
33 Pithy Tips for LinkedIn (EACH in 140 Characters or Less) 1.4K Shares Facebook 207 Twitter 654 LinkedIn 422 inShare425 Google+ 79 Pin It Share 0 1.4K Shares × My relationship to LinkedIn is like my relationship to vegetables… I know they’re good for me, but definitely don’t eat enough.
And until recently, I never really spent time on LinkedIn. But friends kept telling me to use it more. And now that I’ve done that, I like what I see! How could I not? 313 million members187 million unique visitors per month Not bad, right? Check out the tips! 1. >> Click to Tweet Before a presentation, update your LinkedIn profile; attendees will review it to assess your credibility. 2. >> Click to Tweet Transform a generic link to your website into a call-to-action, especially on company profiles. 3. >> Click to Tweet Create entries for every role you have performed within each job title. 4.
>> Click to Tweet. 33 Pithy Tips for LinkedIn (EACH in 140 Characters or Less) 33 Pithy Tips for LinkedIn (EACH in 140 Characters or Less) Social Media Shortcuts #infographic. The Effective Use of Research in Creating Marketing Infographics. For an infographic to be successful in sending a marketing message or sharing valuable information to a business community, it should be backed by credible research.
Without it, the entire content piece will falter altogether, and no one would ever look at your infographic again. Making sure that research is solid and used appropriately is the most important fiber in infographic creation. Sure, dazzling visual content is what this type of media is all about, but the research aspect is what intellectually satisfies the hungry minds of the readers. Amazing Social Selling #Infographics You Need t... Pin by Josepf J on Social Marketing #Infographics. Pin by Neal Schaffer on Social Media Infographics. Socialable - A Leading Global Social Media Marketing Agency. 39.2K Flares Twitter 3K Facebook 109 Google+ 140 StumbleUpon 35.6K Pin It Share 38 38 LinkedIn 191 inShare191 Email -- Email to a friend Buffer 83 39.2K Flares × Infographics are all the rage at the moment – I’ve been saying this for a while now and it’s great to see that they’re still as popular as when they first burst into the social scene.
People love them as they are full of value, they are educational, quick to read and entertaining. But you probably already know that and already have an infographic in the pipeline, just waiting to share it with the world. Unfortunately, because of all the noise in this vast Internet maize, it’s no easy task getting your infographic out there, and even the most beautiful ones need lots of heavy promotion to get in front of as many people as possible, generate shares and get plenty of quality backlinks.
Recipe for Creating Infographics. Infographics are popular.
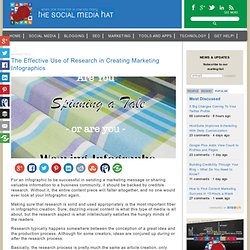
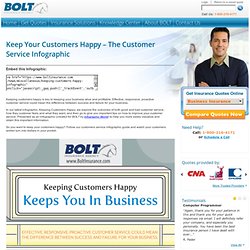
They offer the ability to transmit information in a more digestible form than blocks of text and they’re particularly good for explaining ideas. Breaking Down GE’s Social Media Success [INFOGRAPHIC] By Jason Keath on Jun 03, 2013 We have featured GE a few times for their great content marketing and social media success.
![Breaking Down GE’s Social Media Success [INFOGRAPHIC]](http://cdn.pearltrees.com/s/pic/th/breaking-success-infographic-121335671)
They are a B2B brand, but because of the scale of their products, their marketing is more similar to that of a large consumer brand. I personally enjoy following them on Facebook and on Instagram. The great images and intelligent content they share is thought provoking and educational. From jet turbines to freight trains to quizes about science. GE sets itself apart from the crowded social stream we are all use to, filled with cute dogs, selfies, and pictures of everyone’s food. The folks over at content startup Swayy put together the below infographic outlining GE’s social media success. Enjoy. 10 Ways To Promote An Infographic. Keeping Customers Happy Infographic - Customer Service - Bolt Insurance. Embed this Infographic: <a href=" onclick="javascript:_gaq.push(['_trackEvent','outbound-article',' src=" alt="keeping customers happy infographic customer service" width="800" border="0" /></a><br />Via: <a href=" onclick="javascript:_gaq.push(['_trackEvent','outbound-article',' Insurance</a> Keeping customers happy is key to keeping your business alive and profitable.
Effective, responsive, proactive customer service could mean the difference between success and failure for your business. In our latest infographic, Keeping Customers Happy, we explore the outcomes of both good and bad customer service, how they customer feels and what they want, and then go to give you important tips on how to improve your customer service. Mobile-Payment-Processor-Market.jpg (JPEG Image, 960x2400 pixels) - Scaled (26. Super Basic Social Media Checklist For Businesses #Infographic. The 16 best tools to make awesome Inforgraphics. Lilach Lilach is the founder and driving force behind Socialable, and highly regarded on the world speaker circuit.

Forbes and Number 10 Downing Street have even been graced by her presence! In a nutshell, she’s a hugely connected and highly influential serial entrepreneur – the embodiment of Digitelligence.Listed in Forbes as one of the top 20 women social media power influencers and likewise as one of the top social media power influencers, she is one of the most dynamic personalities in the social media market, she actively leverages ethical online marketing for her clients and for Socialable. After launching her first business within three years of becoming a mother, her financial success was recognised by being a finalist at the Best MumPreneur of the Year Awards, presented at 10 Downing Street. Faceybooks-full. A Guide to Kickstarter and Crowd Funding [INFOGRAPHIC]
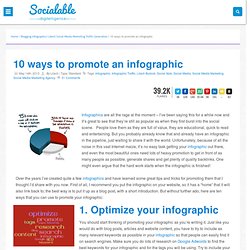
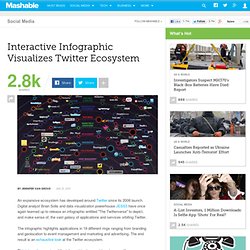
Kickstarter is one of the most visible companies in the burgeoning crowd funding space — if not the only player in the game — thanks to projects like the iPod nano watch kit.
![A Guide to Kickstarter and Crowd Funding [INFOGRAPHIC]](http://cdn.pearltrees.com/s/pic/th/kickstarter-infographic-9792745)
And now, the teams at ZippyCart and Killer Infographics have put together an excellent diagram showing off the science of crowd funding. The infographic serves not only as a guide of sorts to the Kickstarter process, but also as a history of crowd funding as we know it. Click to enlarge. Facebook vs. Twitter: An Infographic: Tech News « Killer Infographic — elysa says. How the Recession Changed Us - Magazine. What a difference two years makes.

Graphic by: Amanda Buck Officially, the Great Recession lasted from December 2007 to June 2009. A mere 18 months—about average, as recessions go. Yet if the trauma this time feels deep and lasting, that may be because, as the figures on these pages show, so many disruptions have upended national life at once. Millions of Americans have lost their jobs, nearly every state faces a budget shortfall, and hundreds of banks have shut their doors. Social Media Growth Statistics. Interactive Infographic Visualizes Twitter Ecosystem. An expansive ecosystem has developed around Twitter since its 2006 launch.
The Staggering Size of the Internet [INFOGRAPHIC]