
CompleteGuideToInfographics. Easel.ly. Infoactive. Venngage. Venngage. 20 Free Infographic Vector Element Kits. Infographic Shows The Differences Between The Diseases We Donate To, And The Diseases That Kill Us. Julia Belluz created the infographic below to compare how much money is donated to fight various disease and how many people in the USA die from those same diseases for an article in Vox.

The graphic has since developed a bit of a life of its own. Belluz uses it to critique celebrity-driven campaigns for rare diseases such as the ice bucket challenge for ALS, compared to more frequent, but less glamorous conditions The discrepancy the graphic is pretty striking, and certainly worth thinking about, but it's hardly the last word. For example, HIV may not be a major killer of Americans, but the people donating are probably concerned about the devastation it wrecks globally. Indeed the article quotes 80,000 hours founder William MacAskill saying, "Donating money to the best developing world health charities will reach at least 100 times as many people than if you donate to developed world health causes.
" It's also relevant to think not just about numbers of deaths, but numbers of years lost. 10 free tools for creating infographics. Done right, infographics can be a great way to make sense of complex data.
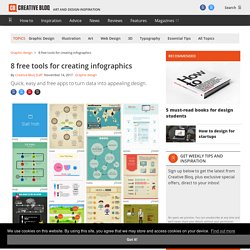
The best infographics transform complex information and data into graphics that are both easy to grasp and visually appealing. The only problem is, infographics that look like they were simple to make are often anything but. Exclusive offer: Save 15% on Adobe Creative Cloud now Here, we've selected our top free tools and apps for making infographics. Some of the options here are even suitable for non-designers, as templates and other features make them easy to use. Give these free tools a try and let us know which ones you get on best with on Facebook or Twitter. 01. Visme promises to help you 'speak visually'. 02. Canva is a powerful and easy-to-use online tool that's suitable for all manner of design tasks, from brochures to presentations and much more besides. 03. Google's chart tools are powerful, simple to use, and free. 04. 05. 06. Create and share visual ideas online.
Create Easy Infographics, Reports, Presentations. 20+ Tools to Create Your Own Infographics. A picture is worth a thousand words – based on this, infographics would carry hundreds of thousands of words, yet if you let a reader choose between a full-length 1000-word article and an infographic that needs a few scroll-downs, they’d probably prefer absorbing information straight from the infographic.
What’s not to like? Colored charts and illustrations deliver connections better than tables and figures and as users spend time looking back and forth the full infographic, they stay on the site longer. Plus, readers who like what they see are more likely to share visual guides more than articles. While not everyone can make infographics from scratch, there are tools available on the Web that will help you create your very own infographics. In this article, we’re listing more than 20 such options to help you get your messages across to your readers, visually.
Read Also: The Infographic Revolution: Where Do We Go From Here? What About Me? “What About Me?” Vizualize.me. Create. 10 Awesome Tools To Make Infographics. Advertisement Who can resist a colourful, thoughtful venn diagram anyway?

In terms of blogging success, infographics are far more likely to be shared than your average blog post. This means more eyeballs on your important information, more people rallying for your cause, more backlinks and more visits to your blog. In short, a quality infographic done well could be what your blog needs right now. Designing An Infographic Some great tips for designing infographics: Keep it simple! Ideas for infographic formats include: Timelines;Flow charts;Annotated maps;Graphs;Venn diagrams;Size comparisons;Showing familiar objects or similar size or value. Here are some great tutorials on infographic creation: Creating Your Infographic Plan and research.If required, use free software to create simple graphs and visualisations of data.Use vector graphic software to bring these visualisations into the one graphic.
Free Online Tools For Creating Infographics Stat Planet Hohli Creately New York Times Many Eyes.
Over 100 Incredible Infographic Tools and Resources (Categorized) This post is #6 in DailyTekk’s famous Top 100 series which explores the best startups, gadgets, apps, websites and services in a given category.

Total items listed: 112. Time to compile: 8+ hours. Follow @DailyTekk on Twitter to make sure you don’t miss a week! Update: Be sure to check out our latest post on infographics: Infographics Are Everywhere – Here’s How to Make Yours Go Viral. I love a good infographic! Many Eyes. InfoGraphic Designs: Overview, Examples and Best Practices. Information graphics or infographics are visual representations of information, data or knowledge.
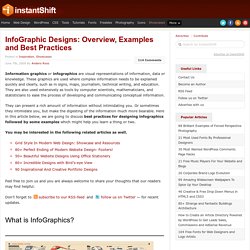
These graphics are used where complex information needs to be explained quickly and clearly, such as in signs, maps, journalism, technical writing, and education. They are also used extensively as tools by computer scientists, mathematicians, and statisticians to ease the process of developing and communicating conceptual information.