
20 Amazing Infographics On Real Estate. 46EmailShare Real estate is an important part of the business world and forms a huge and highly popular industry.
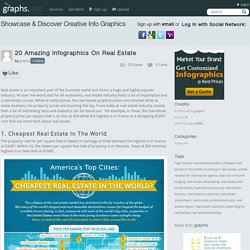
All over the world and for all economies, real estate industry holds a lot of importance and is extremely crucial. While at some places, the real estate property prices are minimal while at some locations, the property prices are touching the sky. If one looks at real estate industry closely, then a lot of interesting facts and statistics can be found out. For example, in Texas, the real estate property price per square foot is as less as $54 while the highest is in France at a whopping $3287! 1. The property rate for per square foot is lowest in Santiago at $160 whereas the highest is in France at $3287. Top 10 Best Infographics of 2013. 2013 is coming to an end.

As we begin to close this amazing year and usher in the new year, we’ve decided that this year would not be complete without a list of top 10 best infographics of 2013. So, this is Piktochart top 10 of the most creative, interesting and just outright awesome infographics created in this year of snake. Some are funny, some more serious, but one thing’s for sure, all of them is equally inspiring examples of the infographic art. Let’s end this year with a bang, folks. Enjoy! 1. The designers’ favourite! Source: goldemann.de 2. This interactive infographic shows you why your brain likes infographics. Click on the image to see a full interactive infographic | Source: Neomam Studios. The 83 best infographics. Every picture tells a story, as they say, but sometimes it takes a clever combination of words and pictures to tell a story quickly, concisely and in an entertaining fashion.
The best infographics may look like they were simple to create in Photoshop, but designing an effective piece of data visualization is usually anything but. There are several great tools to create infographics, but these examples of infographics from around the web will show you how you can take it a step further and add a bit of style and personality to your data. Some are older than others, but they can still provide some inspiration for those of you looking to create an infographic from scratch. Some are funny, some more serious, and all are inspiring examples of the art.
If Star Wars: The Last Jedi has put you in the mood to immediately watch the original movie, hold your horses just one second. 02. 03. Are you reading this slumped at your desk? Cool Infographics, Infographic Design, Amazing Infographics. Cool Information Design & Information Graphics. Six amazing infographics reveal what London’s really like. (Click on the image to make it bigger) A few fun facts for you stats fans: residents in Enfield are way happier than those in Hammersmith, Clapham is a great place to pull, and Islington (with a birth rate that’s way below average) is a great place to live if you want to avoid babies.
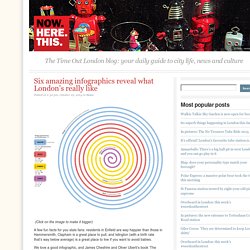
We love a good infographic, and James Cheshire and Oliver Uberti’s book ‘The Information Capital’ has some fantastic ones brimming full of great London stats. First up is the bright swirly image above which tells us that in 2012 Londoners watched nearly twice as many theatre performances as music gigs, and for every 100,000 of us we watched just 35 dance shows. (Click on the image to make it bigger) Now for the serious stuff, this is a life or death situation. What do we learn from this infographic?
10 Awesome Infographics to Guide Your Marketing Plan for 2014. Infographics seem to be getting more and more popular lately.

They’re certainly fun to look at, and they convey useful information in a format that’s fast and easy to digest. One thing to keep in mind with infographics is that they’re generally static—unlike blog posts, they’re rarely updated as new information becomes available. To help you get your 2014 marketing strategy off to a great start, we’ve rounded up 10 infographics with useful stats, information and suggestions about online marketing. 1. 20 Captivating Marketing Statistics that will Drive 2014 This infographic from WebDAM looks ahead to 2014 to explore the trends and changes we can expect. 2.
Marketo‘s email marketing infographic has some really interesting stats, including how the time you send an email affects the open rate. 20 Amazing Marketing Statistics That Will Drive 2014 (Infographic) As we have flipped the calendar to 2014 and closed the chapter of 2013.
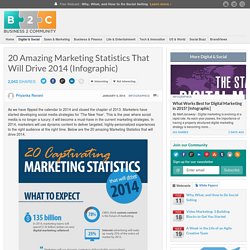
Marketers have started developing social media strategies for ‘The New Year’. This is the year where social media is no longer a luxury; it will become a must-have in the current marketing strategies. In 2014, marketers will use dynamic content to deliver targeted, highly-personalized experiences to the right audience at the right time. Below are the 20 amazing Marketing Statistics that will drive 2014. What to expect 78% of CMOs think that custom content is the future of marketing. Trends in the marketing mix Social Media: Social media marketing budgets will double over the next 5 years.Content: Nearly 50% of companies now have content marketing strategies.