Merging my art printmaking process with Processing code. In Simplicity there is Complexity - NEW ART - Favianna.com. I'm writing this from Aspen, Colorado where I'm taking a one-week intensive class in Processing with acclaimed artist, Joshua Davis.
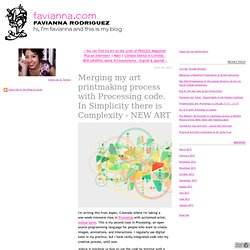
This is my second class in Processing, an open source programming language for people who want to create images, animations, and interactions. I regularly use digital tools in my practice, but I have rarely integrated code into my creative process, until now. Joshua is teaching us how to use the code by starting with a grid. We began with a simple structure and started building out from there. The code pulls shapes from vector files, which are files that are based in points and lines. While I was here, I had the realization that my printmaking practice (when I do monotypes) and digital practice fundamentally are based on the same steps. Shapes make up the composition - I start out with shapes and constructions that will make the whole. The scripts I'm working on in Processing are also accidental - we have designed them that way.
Hour of Code. Hints after video one.

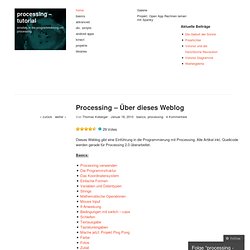
This may never be seen? Draw a picture made of ellipses and rectangles! For example, you could make a self-portrait, an alien creature, or something more abstract. It'll just be black and white for now, we'll get to color in the next video. You can work on your own pace, but we recommend approximately ten minutes on this assignment before moving on. Reminders To draw a rectangle: rect(a,b,c,d); To draw an ellipse: ellipse(a,b,c,d); a — X (horizontal) location of the shape's upper-left cornerb — Y (vertical) location of the shape's uppper-left cornerc — width of the shaped — height of the shape. Processing.org. The Second Elusion. Tobystereo.com. Blog + News » Free Video Delay in Processing. Mycelium [Processing] - Fungal hyphae growth using images as food //app by @notlion. Mycelium is a simulation of fungal hyphae growth using images as food, created by Ryan Alexander.
![Mycelium [Processing] - Fungal hyphae growth using images as food //app by @notlion](http://cdn.pearltrees.com/s/pic/th/mycelium-processing-notlion-24764281)
The project originally started in 2005 while he was working at Logan in Venice, California. Click images to see full size. Hyphae grow into the lighter areas of the image while avoiding their own trails. Branching and growth speed are also functions of the avalible food (brightness) in the image. Type can be added by splitting the trails up into phrase-sized chunks of different colors. Music Is Math. Toxiclibs showreel 2009.
Audio and beat reaction No. 2. Point cloud. Download Meshlab ( or use some other software to manage 3D point clouds.
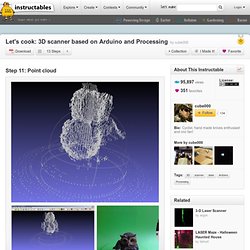
Import your *.asc file, simple by drag and drop method. Uncheck triangulation and hit OK. You will get see cloud points of scanned object! Success! I cannot do almost anything more in Meshlab, because it is crashing a lot. Isn't it lovely? Processing DataVis. Hello World! Processing. Processing – Über dieses Weblog « processing – tutorial. Dieses Weblog gibt eine Einführung in die Programmierung mit Processing.
Alle Artikel inkl. Quellcode werden gerade für Processing 2.0 überarbeitet. Basics: Aufgaben zu Basics Advanced: Div. Android Apps mit Processing erstellen: Kinect mit SimpleOpenNI: Projekte: Libraries Für Kommentare, Anregungen und Verbesserungsvorschläge bin ich jederzeit dankbar! Projektseite: Hier findest du neben dem Programm selbst auch noch viele Anwendungsbeispiele, die Programm – Referenz und einige gute Tutorials für den Einstieg in Processing. About these ads Gefällt mir: Gefällt mir Lade... Codes - GENERATIVE GESTALTUNG. BibleViz. This set of visualizations started as a collaboration between Christoph Römhild and myself.
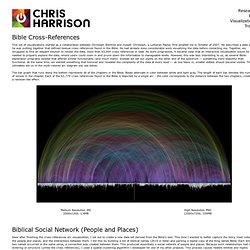
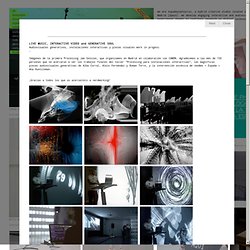
Christoph, a Lutheran Pastor, first emailed me in October of 2007. He described a data set he was putting together that defined textual cross references found in the Bible. He had already done considerable work visualizing the data before contacting me. Together, we struggled to find an elegant solution to render the data, more than 63,000 cross references in total. As work progressed, it became clear that an interactive visualization would be needed to properly explore the data, where users could zoom in and prune down the information to manageable levels. The bar graph that runs along the bottom represents all of the chapters in the Bible. Soon after finishing the cross-references arc visualization, I set out to create a new data set derived from the Bible’s text. Additional details: Entities with less than 40 connections are drawn at an angle. 1# Processing Jam Session, Madrid - www.espadaysantacruz.com. LIVE MUSIC, INTERACTIVE VIDEO and GENERATIVE SOUL Audiovisuales generativos, instalaciones interactivas y piezas visuales work in progess.