2020 Energy. Affiche scientifique. Le site Affiche scientifique présente divers documents (guides, normes, gabarits et autres) rassemblés pour vous permettre de découvrir et considérer les aspects d'une affiche scientifique (poster), c'est-à-dire pour franchir toutes les étapes du processus menant à sa réalisation et pour contribuer à faire de votre projet une réussite!
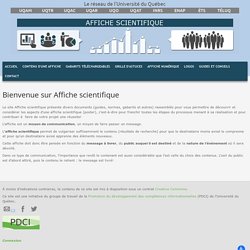
L'affiche est un moyen de communication, un moyen de faire passer un message. L'affiche scientifique permet de vulgariser suffisamment le contenu (résultats de recherche) pour que le destinataire moins avisé le comprenne et pour qu'un destinataire avisé apprenne des éléments nouveaux. Cette affiche doit donc être pensée en fonction du message à livrer, du public auquel il est destiné et de la nature de l'événement où il sera dévoilé.
Dans ce type de communication, l'importance que revêt le contenant est aussi considérable que l'est celle du choix des contenus. AirVisual - Earth. Alltagssprache: Bulette oder Frikadelle, Bolzen oder Kicken. Dienstag, 30.08.2016 11:43 Uhr.
Ancient Earth globe. Antmaps. Apprendre l'anatomie de la fleur. Aqua Monitor. Arctic Sensor Web Platform. Arctic Web Map. AstroViewer - Current position of the ISS. Bathymetry Data Viewer. ●Contact Us Navigating the map Click and drag or use arrow keys to pan Mouse scroll forward or use + key to zoom in Mouse scroll backward or use - key to zoom out Identifying features You have several options to identify features within visible layers: Single-click on the map Or, choose another tool from the "Identify" menu: Click on to draw a rectangle Click on to draw a polygon Click on to enter coordinates for a bounding box A popup will appear with a list of the selected features.
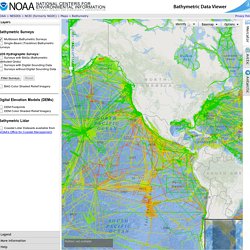
Mouse-over the list of files within an instrument folder to highlight features on the map (blue line). Click the magnifying glass icon to zoom to that feature. BioDigital Human. BioInteractive. Build-A-Body. Overview Learn about the body's systems with this drag and drop game.
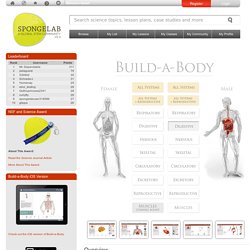
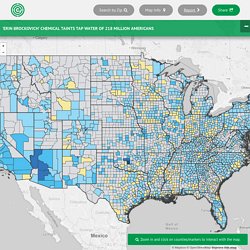
Choose organs from the organ tray, and place them in their correct position within the body to create organ systems. Build-A-Body is a drag and drop game where players are tasked with assembling an organ system from a set of organs. Players may then attempt case studies where a functional problem with a system must be linked to the organ affected. CERNLand. Chimie : décrire la matière. Chimie : transformer la matière. Chromium-6 in Water Utilities. On the map, click on counties/markers for more information.
Chromoscope. Classe de sciences. Climate Maps. Conservation Science Data and Tools. WWF constantly looks for new opportunities to improve the effectiveness and efficiency of our conservation work.
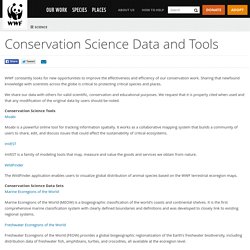
Sharing that newfound knowledge with scientists across the globe is critical to protecting critical species and places. Corpus. Cosmo Voyageur. Dark Sky Maps. De simples machines. Dissocier les liquides et les solides. Dissocier les mammifères, les reptiles et les poissons. Dissocier les omnivores, les herbivores et les carnivores. E-Bug. Earth Viewer. Earth Wind Map. EEA Data and maps. Encyclopédie de l'environnement. Environmental Data Explorer. ESA Star Mapper. EUMETSAT Learning Zone.
European Soil Data Centre. Fire Data in Google Earth. KML Access:The links below provide access to several geospatial datasets relevant to fire management in Keyhole Markup Language (KML/KMZ) format for use in Google Earth and other virtual globe applications.
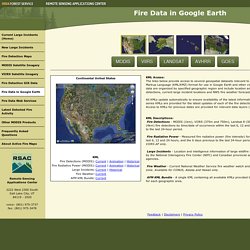
Geospatial data are organized by specified geographic region and include location and characterization of satellite fire detections, current large incident locations and NWS fire weather forecasts. All KMLs update automatically to ensure availability of the latest information (Current link). Animatated time series KMLs are provided for the latest updates of each of the fire detection data layers (Animation link). Fire Detection GIS Data. MODIS Fire Detection GIS Data: MODIS fire detection data for the current year are compiled Terra and Aqua MODIS fire and thermal anomalies data generated from MODIS near real-time direct readout data acquired by the USDA Forest Service Remote Sensing Applications Center, University of Wisconsin Space Science and Engineering Center, University of Alaska-Fairbanks Geographic Information Network of Alaska, the NASA Goddard Space Flight Center Direct Readout Laboratory, and NASA Goddard Space Flight Center MODIS Rapid Response System.
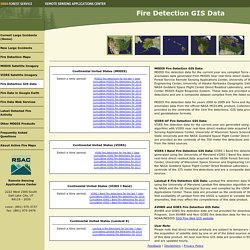
These data are provided as the centroids of the 1km fire detections and are a composite dataset compiled from the listed sources. MODIS fire detection data for years 2000 to 2009 are Terra and Aqua MODIS fire and thermal anomalies data from the official NASA MCD14ML product, Collection 5, Version 1. These data are provided as the centroids of the 1km fire detections. Geology of the Grand Canyon. Leaflet | George Billingsley et al. © Mapbox © OpenStreetMap and Ryan Clark, 2014 Geologic Map of the Grand Canyon and Vicinity Back to the map This work-in-progress represents a spectacular set of data generated by George Billingsley and others at the USGS.
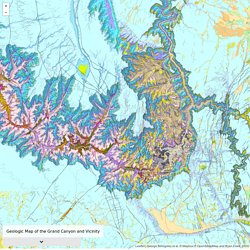
The geologic data shown here was taken from the following USGS publications: "I just hiked my ass off in the canyon gathering the field data. " Website by Ryan Clark, 2013. GEOSS Portal. Global Data Explorer. Global Fishing Watch. Global Forest Change. Global Forest Watch Water. GloVis Next - Beta. Google Earth/KML Files. Real-Time EarthquakesDisplay real-time earthquakes, seismicity animations, and several real-time earthquake options including color by age/depth.
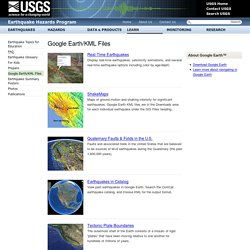
ShakeMapsMaps of ground motion and shaking intensity for significant earthquakes. Google Earth KML files are in the Downloads area for each individual earthquake under the GIS Files heading. Quaternary Faults & Folds in the U.S.Faults and associated folds in the United States that are believed to be sources of M>6 earthquakes during the Quaternary (the past 1,600,000 years). Earthquakes in CatalogView past earthquakes in Google Earth. Search the ComCat earthquake catalog, and choose KML for the output format. Tectonic Plate BoundariesThe outermost shell of the Earth consists of a mosaic of rigid “plates” that have been moving relative to one another for hundreds of millions of years. GPlates Cesium. HEDAVI (HEritage DAta Visualisation) High Resolution Imaging Science Experiment. Historical Hurricane Tracks.
IGEMS. ISS HD Earth Viewing Experiment on USTREAM. Black Image = International Space Station (ISS) is on the night side of the Earth. No Audio = Normal. There is no audio by design. Add your own soundtrack. For a display of the real time ISS location plus the HDEV imagery, visit here: The High Definition Earth Viewing (HDEV) experiment aboard the ISS was activated April 30, 2014.
Analysis of this experiment will be conducted to assess the effects of the space environment on the equipment and video quality which may help decisions about cameras for future missions. ISS Live. Landsat Viewer. L'eau, une ressource vitale à protéger et à partager. L'eau dans tous ses états ! L'énergie nucléaire. Le corps humain. Le Petit Prince et le vent. Le système solaire.
Les cinq sens. Les éclipses solaires et lunaires. Les volcans. Lexique climatique. Map for Environment. Map of Life. MarineCadastre. Meteor showers from space. What am I looking at? Meteor showers on Earth are caused by streams of meteoroids hitting our atmosphere. These meteoroids are sand- and pebble-sized bits of rock that were once released from their parent comet. Some comets are no longer active and are now called asteroids. This visualization shows these meteoroid streams orbiting the Sun, some stretching to the outer regions of the solar system. Select the meteor shower in the menu to see the corresponding meteoroid stream in space. MeteoEarth. Migrations in Motion. As climate change alters habitats and disrupts ecosystems, where will animals move to survive?
And will human development prevent them from getting there? This map shows the average direction mammals, birds, and amphibians need to move to track hospitable climates as they shift across the landscape. How? Researchers from University of Washington and The Nature Conservancy modeled potential habitat for 2954 species using climate change projections and the climatic needs of each species. MinutePhysics. MODIS/VIIRS Burn Scar Data. MODIS/VIIRS Burn Scar Data: MODIS and VIIRS burn scar data are provided at a spatial resolution of 500 meters and attributed with the approximate day of burning on a per pixel basis (VIIRS burn scar data are oversampled from the native 750 meter resolution).
These products are similar to the official MODIS 500 meter burned area product (MCD45A1), but are based on a different algorithmic approach. The algorithm employed for this product is an automated hybrid algorithm developed by Dr. Louis Giglio, and currently implemented as an Alpha product in the International Polar Orbiter Processing Package (IPOPP) by the NASA Direct Readout Laboratory (DRL). Both IPOPP and the MODIS and VIIRS burn scar science processing algorithms are utilized operationally within the direct readout processing framework managed by the USDA Forest Service Active Fire Mapping Program. MoonCalc. Natural Hazards Viewer. Tsunami Events Tsunami Observations Significant Earthquakes Significant Volcanic Eruptions DART® Deployments Plate Boundaries. Nature Soundmap. NSIDC Data on Google Earth. OneZoom.
Open Source Physics. PBDB Navigator. Periodic Table Map. PhET. Physics games. Physique à Main Levée. Quake Map. Quelques propriétés de l'électricité. Quiz sur le climat. Reach Out Reporter. RealEarth. Référentiel Géologique de la France.
Reverb. Science en Jeu. Sciences Express. Science in the Classroom. SciShow. SciShow Kids. Sentinel Playground. Smithsonian - Global Volcanism Program.