
Long-term effects of COVID-19 - WHO <PDF> COVID-19: Long-term effects -Mayo Clinic. COVID-19 (coronavirus): Long-term effects COVID-19 symptoms can sometimes persist for months.
The virus can damage the lungs, heart and brain, which increases the risk of long-term health problems. By Mayo Clinic Staff Most people who have coronavirus disease 2019 (COVID-19) recover completely within a few weeks. But some people — even those who had mild versions of the disease — continue to experience symptoms after their initial recovery. Older people and people with many serious medical conditions are the most likely to experience lingering COVID-19 symptoms. FatigueCoughShortness of breathHeadacheJoint pain Although COVID-19 is seen as a disease that primarily affects the lungs, it can damage many other organs as well.
Long-Haulers Are Redefining COVID-19. Editor’s Note:The Atlantic is making vital coverage of the coronavirus available to all readers.

Find the collection here. Lauren Nichols has been sick with COVID-19 since March 10, shortly before Tom Hanks announced his diagnosis and the NBA temporarily canceled its season. She has lived through one month of hand tremors, three of fever, and four of night sweats. When we spoke on day 150, she was on her fifth month of gastrointestinal problems and severe morning nausea. She still has extreme fatigue, bulging veins, excessive bruising, an erratic heartbeat, short-term memory loss, gynecological problems, sensitivity to light and sounds, and brain fog. COVID-19 Corona Tracker. Coronavirus Case Counts Are Meaningless* Coronavirus Simulation. Studies Report Rapid Loss of COVID-19 Antibodies.
A pair of studies published this week is shedding light on the duration of immunity following COVID-19, showing patients lose their IgG antibodies—the virus-specific, slower-forming antibodies associated with long-term immunity—within weeks or months after recovery.
With COVID-19, most people who become infected do produce antibodies, and even small amounts can still neutralize the virus in vitro, according to earlier work. These latest studies could not determine if a lack of antibodies leaves people at risk of reinfection. One of the studies found that 10 percent of nearly 1,500 COVID-positive patients registered undetectable antibody levels within weeks of first showing symptoms, while the other of 74 patients found they typically lost their antibodies two to three months after recovering from the infection, especially among those who tested positive but were asymptomatic. NEJM 21.07 rápido descenso AC en COVID leve. The time course of the immune response to experimental coronavirus infection of man. Neutralizing antibody responses to SARS-CoV-2 in a COVID-19 recovered patient cohort and their implications. Antibody testing for COVID-19: A report from the National COVID Scientific Advisory Panel.
Longitudinal evaluation and decline of antibody responses in SARS-CoV-2 infection. Convergent Antibody Responses to SARS-CoV-2 Infection in Convalescent Individuals. How long does Immunity Last (COVID-19) You searched for covid. COVID-19 #CoronaVirus Infographic Datapack. COVID-19 #Coronavirus latest data visualized IMPORTANT READS » Flattening the Curve (NY Times) » Detailed #coronavirus pandemic overview + modelling (Medium) » How does Corona virus compare with flu?

(NY Times) » Coronavirus is very different to Spanish flu (NY Times) Change log UPDATE 12th Mar – added Flattening the Curve UPDATE 11th Mar – revised Case Fatality Rates by Country. Italy up to 6.2%. Updated Recovery rates: 56.6% recovered drops to 55%. Aggregating data from COVID-19 trials. In their Policy Forum “A strategic approach to COVID-19 vaccine R&D” (29 May, p. 948 ), L.

Corey et al. discuss the importance of coordinating randomized clinical trial (RCT) protocols to facilitate the evaluation of coronavirus disease 2019 (COVID-19) vaccines, and they highlight the ACTIV (Accelerating COVID-19 Therapeutic Interventions and Vaccines) public-private partnership as one example of productive collaboration. We agree that coordination across RCTs is crucial to ensure that evidence for the treatment and prevention of COVID-19 is adjudicated and disseminated as quickly and reliably as possible. In the absence of coordination, false positives from underpowered and uncoordinated collections of redundant trials could fuel the proliferation of ineffective and potentially dangerous treatments. To increase the power of RCTs, we have created a pilot repository for RCT protocols led by principal investigators who are open to various levels of collaboration.
Resources for visualizing and mapping COVID-19 data — SAGE Ocean. With COVID-19 at the forefront of our global consciousness, research communities across the globe are putting their full force into collecting, analyzing and sharing data to help us better understand the pandemic.

These free data mapping and visualization platforms provide insights into the numbers in a format that’s digestible both for the research community and the general public. An interactive data dashboard from the Center for Systems Science and Engineering (CSSE) at Johns Hopkins University tracks global COVID-19 cases, deaths and recoveries in real time. All the data is stored on GitHub. Covid-19 (Coronavirus) Update: Chronology of a Pandemic.
About a months since our last update, the world according to Covid-19 cases looks very different.

The absolute number of accumulated cases has almost doubled to now more than 6.4 million and more than 382,000 have died (all figures last updated 04 June 2020). The trend that we identified at the beginning of May, with the USA as a constant epicentre, growing faster than any other country and South America (namely Brazil and Peru) and Russia closing in and Europe stagnating, hast been manifested. Brazil has recently overtaken the United States in the number of daily cases.
Most countries are now developing different strategies to find the ‘new normal’, which ranges from keeping the borders closed to the outside world (New Zealand and Australia), to opening but demanding testing at point of entrance (Iceland) or opening to a number of considered ‘safe’ countries (Germany and many other EU countries). COVID-19 Time Capsule. Please Note This time capsule design was created and is supplied for free by LONG Creations.

Natalie Long has been a long time friend of embark websites and has helped us with several projects. We wanted to return the favor, so we offered to host her files and create this page to help alleviate the traffic she was receiving. Why make a dedicated page? We created this page because the original Facebook post went viral and you guys literally crashed the Dropbox and Google Drive with the sheer amount of downloads. Please remember this is a free resource, and we are trying our best to make it available to everyone! A Timeline of the Coronavirus. Coronavirus maps and charts: A visual guide to the outbreak. Timeline of WHO’s response to COVID-19. WHO provides this timeline of the Organization’s COVID-19 response activities for general information.
WHO will update the timeline on a regular basis and in light of evolving events and new information. Unless noted otherwise, country-specific information and data are as reported to WHO by its Member States. This timeline supersedes the WHO Rolling Updates and WHO Timeline statement published in April 2020. It is not intended to be exhaustive and does not contain details of every event or WHO activity. An interactive web-based dashboard to track COVID-19 in real time - The Lancet Infectious Diseases. In December, 2019, a local outbreak of pneumonia of initially unknown cause was detected in Wuhan (Hubei, China), and was quickly determined to be caused by a novel coronavirus, WHOWHO statement regarding cluster of pneumonia cases in Wuhan, China. namely severe acute respiratory syndrome coronavirus 2 (SARS-CoV-2).
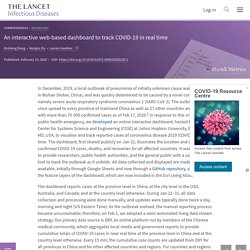
The outbreak has since spread to every province of mainland China as well as 27 other countries and regions, with more than 70 000 confirmed cases as of Feb 17, 2020. Graph theory and COVID-19. Coronavirus 2019-nCoV. Lancet Inf Dis Article: Here. Mobile Version: Here. Data sources: Full list. Downloadable database: GitHub, Feature Layer. Lead by JHU CSSE. Technical Support: Esri Living Atlas team and JHU APL. Cases and Death counts include confirmed and probable (where reported).Recovered cases are estimates based on local media reports, and state and local reporting when available, and therefore may be substantially lower than the true number.
EURO_COVID19_Dashboard - PUBLIC. Figures, colors and icons in country and territory lists Case totals include both probable and confirmed cases reported to WHO. 14-day incidence values represent incidence (# new cases reported) per 100 000 population over the past 14 days. Percentages indicate change in 14-day cumulative incidence as compared to 14 days ago: Reported Transmission Status Pending / under investigation: transmission classification has not been reported to WHO Sporadic cases: one or more cases, imported or locally detected Clusters of cases: experiencing cases, clustered in time, geographic location and/or by common exposures Community transmission: experiencing larger outbreaks of local transmission defined through an assessment of factors including, but not limited to: large numbers of cases not linkable to transmission chains; large numbers of cases from sentinel lab surveillance; and/or multiple unrelated clusters in several areas of the country/territory/area No cases: no confirmed cases Select the legend.
Far reaching. COVID-19 Conglomerates. ... en vue. Myriad Symptoms. COVID-19. SARS-COV-2. Coronaviruses. Viral Health. Test Test Goose. 'Rithmetic. Viruses. Pandemic Problems.