
SARS-CoV-2 mink-associated variant strain – Denmark. - The Washington Post. Coronavirus Showed That America Wasn't Up to the Task. The coronavirus pandemic is in its early days.

But the scale and force of the economic and medical crisis that is about to hit the United States may turn out to be as formidable as Perry’s famous voyage was. Two weeks ago—it already seems like an infinity—I was in Italy, writing about the first signs of the virus. Epidemics, I wrote, “have a way of revealing underlying truths about the societies they impact.” This one has already done so, and with terrifying speed. What it reveals about the United States—not just this administration, but also our health-care system, our bureaucracy, our political system itself—should make Americans as fearful as the Japanese who heard the “distant thunder” of Perry’s guns. Not everybody has yet realized this, and indeed, it will take some time, just as it has taken time for the nature of the virus to sink in. The United States also had an early warning of the new virus—but it, too, suppressed that information. Coronavirus tracked: the latest figures as countries fight to contain the pandemic.
FT Visual & Data Journalism team November 10, 2020 Print this page The human cost of coronavirus has continued to mount, with more than 50.2m cases confirmed globally and more than 1.24m people known to have died.

The World Health Organization declared the outbreak a pandemic in March and it has spread to more than 200 countries, with severe public health and economic consequences. Cases in U.S. More U.S.

Johns Hopkins Coronavirus Resource Center. Introductions and early spread of SARS-CoV-2 in the New York City area. Blighted Gotham Deaths caused by severe acute respiratory syndrome coronavirus 2 (SARS-CoV-2) in New York City (NYC) during the spring of 2020 have vastly exceeded those reported in China and many other countries.

What were the early events that led to such a severe outbreak? Gonzalez-Reiche et al. sampled some of the early patients seeking assistance in February and March of 2020 at the Mount Sinai Health System. Phylogenetic analysis of virus sequences in these people, who were drawn from across NYC, showed that the virus had been independently introduced many times from Europe and elsewhere in the United States. Subsequent clusters of community transmission occurred. Science this issue p. 297 Abstract. COVID-19: This tool tracks coronavirus's path in Europe. While some European countries are easing restrictions, others remain under lockdown.

The World Economic Forum created a tool tracking the distinct path of COVID-19 within European countries. Europe is starting down an uneven road to recovery. Denmark is reopening society more quickly than anticipated, and Switzerland is eyeing the easing of emergency measures. Graphiques sur la Covid-19: 4 choses à savoir. Cet article fait partie de la rubrique du Détecteur de rumeurs, cliquez ici pour accéder aux autres textes.

L’image qui revient le plus souvent dans les médias est celle de l’évolution du nombre de cas de coronavirus, dans un pays ou dans plusieurs, comme le fait le graphique du Financial Times ci-haut, remis à jour quotidiennement. Cela permet de comparer les pays entre eux, mais c’est une information incomplète. 1) S’attarder au nombre de décès ou d’hospitalisations plutôt qu’au nombre de cas Le nombre de décès est plus révélateur que le nombre de cas, parce qu’un nombre indéterminé de cas ont échappé au dépistage. En outre, le rythme de dépistage et la sélection des groupes testés varie d’un pays à l’autre et d’un territoire à l’autre.
Le Financial Times publie à ce sujet une série de tableaux portant sur la progression du nombre de décès dans plusieurs pays, à partir du jour du 3e décès comptabilisé dans ce pays. 3) Les données par million d’habitants sont plus pertinentes. Graphs and maps — EUROMOMO. Reported CoViD-19 Cases in India by Districts. How coronavirus spread across the globe - visualised. Since New Year’s Eve the world has lived through 100 days of Covid-19.
There have been over 1.3m confirmed cases, and over 75,000 deaths. Billions of people are confined to their homes and stock markets have plummeted. Here is how the crisis unfolded. Map animation: Covid-19's spread across the world. “#China has reported to WHO a cluster of #pneumonia cases —with no deaths— in Wuhan, Hubei Province 🇨🇳 .

Investigations are underway to identify the cause of this illness.” This tweet sent out by the World Health Organization (WHO) one year ago broke the news of what was to become the defining global health challenge in 2020. Two and a half weeks later (21.01.2020) WHO started releasing regular situation reports of this previously unknown virus disease that was first reported to the organisation’s country office in China on 31st December 2019. First broadly referred to as Coronavirus, the outbreak was declared a Public Health Emergency of International Concern on 30 January. Coronavirus. Online map. Tracking the Spread of the Outbreak.
Coronavirus numbers worldwide tracked: How COVID-19 is spreading around the globe. What Is Coronavirus: Mapping the Pneumonia-Like Respiratory Illness in China, Globally. Esri. As hundreds of millions of eyes stay glued to the rising toll and reach of the novel coronavirus disease 2019 (COVID-19), map-based dashboards have become a compelling, near real-time way to monitor the outbreak.
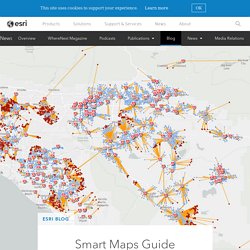
They’ve also substantiated the message that everyone must take precautions and alter daily interactions. When the World Health Organization (WHO) declared COVID-19 a pandemic, director-general Tedros Adhanom Ghebreyesus warned that the situation would worsen. Yet, he noted, this is the first world pandemic that can be controlled, in part due to global connectivity and awareness. The controllability of COVID-19 can also be attributed to tools that quantify data inputs—and aggregate information about who and when in the context of where. Geographic information system (GIS) technology underpins mapping dashboards and provides the means to investigate and understand the spread, guide control measures, and assess strategies for COVID-19 response. Analyzing and Containing Outbreaks Dr. TrackCorona - COVID-19 Tracker and Live Map. OverTime.
Viral Health. Myriad Symptoms. Test Test Goose. COVID-19 Conglomerates. COVID-19. Pandemic Problems. Robust. Corona.