
One 18-Hour Flight, Four Coronavirus Infections. The versions of the coronavirus that all seven carried were virtually identical genetically — strongly suggesting that one person among them initiated the outbreak.
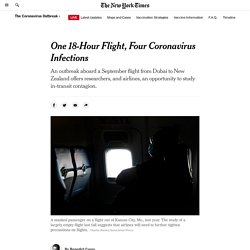
That person, whom the report calls Passenger A, had in fact tested negative four or five days before boarding, the researchers found. “Four or five days is a long time,” Dr. Kamar said. “You should be asking for results of rapid tests done hours before the flight, ideally.” Even restrictive “Covid-free” flights, international bookings that require a negative result to board, give people a day or two before departure to get a test. The findings are not definitive, cautioned the authors, led by Dr. Previous studies of infection risk during air travel did not clearly quantify the risk, and onboard air filtration systems are thought to reduce the infection risk among passengers even when a flight includes one or more infected people.
Airline policies vary widely, depending on the flight and the carrier. JHU 5/12/20 CFR. Europe’s Deadly Second Wave: How Did It Happen Again? Source: New York Times database.
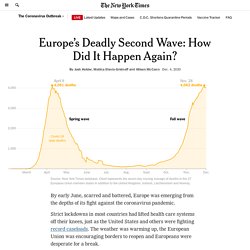
Chart represents the seven-day moving average of deaths in the 27 European Union member states in addition to the United Kingdom, Iceland, Liechtenstein and Norway. By early June, scarred and battered, Europe was emerging from the depths of its fight against the coronavirus pandemic. Strict lockdowns in most countries had lifted health care systems off their knees, just as the United States and others were fighting record caseloads. The science of superspreading. Charting a Covid-19 Immune Response. Amid a flurry of press conferences delivering upbeat news, President Trump’s doctors have administered an array of experimental therapies that are typically reserved for the most severe cases of Covid-19.
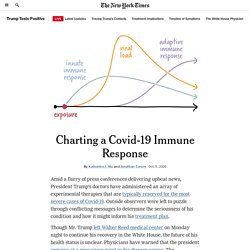
Outside observers were left to puzzle through conflicting messages to determine the seriousness of his condition and how it might inform his treatment plan. Though Mr. Trump left Walter Reed medical center on Monday night to continue his recovery in the White House, the future of his health status is unclear. Coronavirus: The Hammer and the Dance. As of today, there are 0 daily new cases of coronavirus in the entire 60 million-big region of Hubei. The diagnostics would keep going up for a couple of weeks, but then they would start going down. With fewer cases, the fatality rate starts dropping too. And the collateral damage is also reduced: fewer people would die from non-coronavirus-related causes because the healthcare system is simply overwhelmed. Suppression would get us: Fewer total cases of CoronavirusImmediate relief for the healthcare system and the humans who run itReduction in fatality rateReduction in collateral damageAbility for infected, isolated and quarantined healthcare workers to get better and back to work.
Coronavirus: Why You Must Act Now. If you stack up the orange bars until 1/22, you get 444 cases. Now add up all the grey bars. They add up to ~12,000 cases. So when Wuhan thought it had 444 cases, it had 27 times more. If France thinks it has 1,400 cases, it might well have tens of thousands The same math applies to Paris. Coronavirus: Learning How to Dance. South Korea is relevant as the first country that has successfully vanquished an outbreak and is now successfully dancing — without country-wide lockdowns.
Singapore is relevant because it danced for a long time successfully; we can learn from its mistakes. And Taiwan is relevant because they never had an outbreak at all despite being extremely close to China. Coronavirus: Countries and regions impacted so far. Coronavirus cases in Singapore: What we know so far. Long term health effects. WHO Scientific Brief on Covid-19 Mortality in real time. Coronavirus: Iran cover-up of deaths revealed by data leak.
Image copyright Getty Images The number of deaths from coronavirus in Iran is nearly triple what Iran's government claims, a BBC Persian service investigation has found.
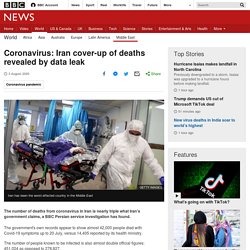
The government's own records appear to show almost 42,000 people died with Covid-19 symptoms up to 20 July, versus 14,405 reported by its health ministry. The number of people known to be infected is also almost double official figures: 451,024 as opposed to 278,827. More than 150,000 Americans have died from Covid-19. Here is that tragic story in figures.
The impact of the Covid-19 pandemic has been greater in the US than on any other country in lives and jobs lost.

As the US passes 150,000 fatalities from the virus, we have gathered some of the most shocking data. These statistics tell a tragic story of how the virus has disproportionately hit older people, people of color and those with lower incomes. They also capture some of the shortcomings in the official responses to its spread. Tracking COVID-19 in the United States. Coronavirus Deaths Are Rising Right on Cue. No other country in the world has attempted what the U.S. appears to be stumbling into.

Right now, many, many communities have huge numbers of infections. When other countries reached this kind of takeoff point for viral spread, they took drastic measures. Covid-19 data - Tracking covid-19 excess deaths across countries. AS COVID-19 has spread around the world, people have become grimly familiar with the death tolls that their governments publish each day.
Unfortunately, the total number of fatalities caused by the pandemic may be even higher, for several reasons. First, the official statistics in many countries exclude victims who did not test positive for coronavirus before dying—which can be a substantial majority in places with little capacity for testing. Second, hospitals and civil registries may not process death certificates for several days, or even weeks, which creates lags in the data. And third, the pandemic has made it harder for doctors to treat other conditions and discouraged people from going to hospital, which may have indirectly caused an increase in fatalities from diseases other than covid-19. Many Western countries, and a handful of nations and regions elsewhere, regularly publish data on deaths from all causes.
The coronavirus pandemic in 28 charts, maps, and graphics. An analysis of three Covid-19 outbreaks: how they happened and how they can be avoided. A crowded restaurant to celebrate the Chinese New Year; 100 workers infected inside a 19-story building; a group of devout Buddhists travelling by bus for a religious ceremony.
These were the scenarios for three outbreaks of Covid-19 that have been carefully documented by the authorities. What happened in each one? Thinking fast and slow - How speedy lockdowns save lives. AS SUMMER ARRIVED, Europeans and Americans might have hoped for a covid-free spell, with the deadly peaks of spring a distant memory.
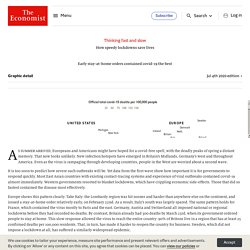
That now looks unlikely. New infection hotspots have emerged in Britain’s Midlands, Germany’s west and throughout America. Even as the virus is rampaging through developing countries, people in the West are worried about a second wave. It is too soon to predict how severe such outbreaks will be. Yet data from the first wave show how important it is for governments to respond quickly. Europe shows this pattern clearly. Daily chart - Tracking the coronavirus across Europe. AT THE beginning of spring much of Europe shut down to slow the spread of covid-19, which has infected nearly 3m people and taken the lives of about 200,000 in the continent’s 54 countries and territories, from the Atlantic to the Urals.
The first wave of infections appears largely to have abated. Countries are returning to some semblance of normality—albeit with social-distancing measures in place. Total confirmed COVID-19 cases. The Fullest Look Yet at the Racial Inequity of Coronavirus. The Pandemic’s Big Mystery: How Deadly Is the Coronavirus? Instead, it had relied on a mix of data sent in by member countries and by academic groups, and on a meta-analysis done in May by scientists at the University of Wollongong and James Cook University in Australia.
Those researchers looked at 267 studies in more than a dozen countries, and then chose the 25 they considered the most accurate, weighting them for accuracy and averaged the data. They concluded that the global I.F.R. was 0.64 percent. Covid-19 data - Tracking covid-19 excess deaths across countries. AS COVID-19 has spread around the world, people have become grimly familiar with the death tolls that their governments publish each day. Unfortunately, these tend to under-count the true number of fatalities that the disease has already caused. In many places, official daily figures exclude anybody who did not die in hospital or who did not test positive. Often the cause of death takes several days to establish and report, which creates a lag in the data.
And even the most complete covid-19 records will not count people who were killed by conditions that might normally have been treated, had hospitals not been overwhelmed by a surge of patients needing intensive care. [Jump to Italy, Spain, France, Britain, Netherlands, Sweden, Belgium, Austria, United States, Jakarta or Istanbul] Data fog: Why some countries' coronavirus numbers do not add up. Florida's Community Coronavirus Dashboard. How to Stay Safe During the Coronavirus Summer. Weekly COVID-19 Data Update, June 25: The US Pandemic Is Surging in the South and West.
The United States saw more new cases this week than any week since the US COVID-19 outbreak began. The COVID Tracking Project. Trajectory of pandemic. Coronavirus Vaccine Tracker. Who Is Most Likely to Die From the Coronavirus? Months into the coronavirus pandemic, scientists have identified some clear patterns in which people who suffer from Covid-19 are most likely to die. Pre-existing medical conditions are one important factor. As of June 3, roughly nine in ten New Yorkers and Chicagoans who died of Covid-19 suffered from underlying chronic conditions.
But those underlying conditions don’t affect everyone equally. They are much more prevalent among lower-income workers, according to researchers at the Centers for Disease Control and Prevention. Rates of chronic obstructive pulmonary disease, kidney disease and diabetes, for example, among the poorest 10 percent of New Yorkers are estimated to be more that 40 percent higher than the median rate.
Prevalence of health conditions among top and bottom 10% of income earners. Models v. Evidence. Coronavirus excess deaths: UK has one of highest levels in Europe. The Pandemic Doesn’t Have to Be This Confusing. Ed Yong and Ross Andersen will discuss the challenges of reporting on COVID-19 live at 2 p.m.
And the desire to name an antagonist, be it the Chinese Communist Party or Donald Trump, disregards the many aspects of 21st-century life that made the pandemic possible: humanity’s relentless expansion into wild spaces; soaring levels of air travel; chronic underfunding of public health; a just-in-time economy that runs on fragile supply chains; health-care systems that yoke medical care to employment; social networks that rapidly spread misinformation; the devaluation of expertise; the marginalization of the elderly; and centuries of structural racism that impoverished the health of minorities and indigenous groups. It may be easier to believe that the coronavirus was deliberately unleashed than to accept the harsher truth that we built a world that was prone to it, but not ready for it. – barbaragrieve
If measuring the present is hard, predicting the future is even harder. The mathematical models that have guided the world’s pandemic responses have been often portrayed as crystal balls. That is not their purpose. They instead describe a range of possibilities, and help scientists and policy makers to simulate what might happen pending different courses of action. Models reveal many possible fates, and allow us to choose one. And while distant projections are necessarily blurry, the path ahead is not unknowable. “The long-term is like modeling the trajectory of a falling leaf, but the short-term is like modeling a falling bowling ball,” says Dylan Morris, an infectious-disease modeler at Princeton. Uncertainties about the year ahead shouldn’t cloud “how devastatingly and terrifyingly certain we can be” about the immediate consequences if the pandemic isn’t controlled, he adds. – barbaragrieve
SARS-CoV-2 is the virus. COVID-19 is the disease that it causes. The two aren’t the same. The disease arises from a combination of the virus and the person it infects, and the society that person belongs to. Some people who become infected never show any symptoms; others become so ill that they need ventilators. Early Chinese data suggested that severe and fatal illness occurs mostly in the elderly, but in the U.S. (and especially in the South), many middle-aged adults have been hospitalized, perhaps because they are more likely to have other chronic illnesses. The virus might vary little around the world, but the disease varies a lot. – barbaragrieve
The idea that there are no experts is overly glib. The issue is that modern expertise tends to be deep, but narrow. Even within epidemiology, someone who studies infectious diseases knows more about epidemics than, say, someone who studies nutrition. But pandemics demand both depth and breadth of expertise. To work out if widespread testing is crucial for controlling the pandemic, listen to public-health experts; to work out if widespread testing is possible, listen to supply-chain experts. To determine if antibody tests can tell people if they’re immune to the coronavirus, listen to immunologists; to determine if such testing is actually a good idea, listen to ethicists, anthropologists, and historians of science. No one knows it all, and those who claim to should not be trusted. – barbaragrieve
ET, Thursday, May 7. Register for The Big Story EventCast here. On March 27, as the U.S. topped 100,000 confirmed cases of COVID-19, Donald Trump stood at the lectern of the White House press-briefing room and was asked what he’d say about the pandemic to a child. The Fable of the Chinese Whistleblower by Stephen S. Roach & Weijian Shan. Lockdown Delays Cost at Least 36,000 Lives, Data Show. Coronavirus cases and deaths over time: how countries compare around the world. Good Science Is Good Science.
One such “trick,” Medawar writes, “is to affect the possession of a mind so finely critical that no evidence is ever quite good enough (‘I am not very happy about. . . .’; ‘I must say I am not at all convinced by. . . .’).” After all, as he writes in a different passage, “no hypothesis in science and no scientific theory ever achieves . . . a degree of certainty beyond the reach of criticism or the possibility of modification.” Scientists must resist the temptation to excessive skepticism: the kind that says no evidence is ever quite good enough. Instead they should keep their eyes open for any kind of information that can help them solve problems. I share Medawar’s pragmatic vision of scientific reasoning. Scientists must resist the temptation to excessive skepticism: the kind that says no evidence is ever quite good enough. Instead they should keep their eyes open for any kind of information that can help them solve problems. Deciding, on principle, to reject some kinds of information outright, or to consider only particular kinds of studies, is counterproductive. Instead of succumbing to what Medawar calls “habitual disbelief,” the scientist should pursue all possible inputs that can sharpen one’s understanding, test one’s preconceptions, suggest novel hypotheses, and identify previously unrecognized inconsistencies and limitations in one’s view of a problem. – barbaragrieve
The impact of lockdown on health risk behaviours. Covid-19's future: small outbreaks, monster wave, or ongoing crisis. Coronavirus Government Response Tracker. -19: New Zealand cases mapped and charted, May 7. Before their time - Would most covid-19 victims have died soon, without the virus? In Africa tracker. Covid-19 data - Tracking covid-19 excess deaths across countries. Roundup of Gallup U.S. COVID-19 Coverage. Coronavirus: Out of Many, One - Tomas Pueyo - Medium. Air traffic before and after Europe's coronavirus lockdowns – video. How Bad Is the Coronavirus Outbreak? Here’s a Key Number.
Daily chart - Tracking covid-19 excess deaths across countries. Persistence of coronaviruses on inanimate surfaces and their inactivation with biocidal agents - Journal of Hospital Infection.
If you are using a disinfectant make sure it says it is antiviral and follow the instructions. Often, we just end up using a cloth to wipe the microbes around rather than actually letting them sit and stew in the disinfectant first so that it can do its job. Surfaces will need about 10 seconds soaking with the disinfectant for it to work. Good disinfectants to look out for are things that contain hypochlorite (which is the main active ingredient in bleach) or activated hydrogen peroxide (0.5%). Others may contain benzalkonium chloride, though some studies have shown this is less effective against coronaviruses. You could also just use conventional bleach (at 0.1-0.2% available chlorine – check the back of your bottle) in water. Or you could just use alcohol. Ethanol is best. Isopropyl alcohol is good too. Methylated spirits is not as good but better than nothing. – barbaragrieve
Siouxsie Wiles: About those cries of ‘over-reaction’ on NZ’s Covid-19 response. Millennials Are the New Lost Generation. The Huge Cost of Waiting to Contain the Pandemic. See Which States and Cities Have Told Residents to Stay at Home. Why Nobody Knows How Many Americans Have the Coronavirus. Coronavirus COVID-19 (2019-nCoV) Coronavirus tracked: the latest figures as the pandemic spreads. Location Data Says It All: Staying at Home During Coronavirus Is a Luxury. Daily chart - American states’ responses to the coronavirus follow party lines. Covid-19: 14,000 could die in NZ if control efforts fail. The maths and ethics of minimising COVID-19 deaths in NZ – Public Health Expert, University of Otago, New Zealand. Supression and Mitigation New Zealand TPM 006. BMI. ICNARC document. List of countries by hospital beds. Coronavirus Deaths by U.S. State and Country Over Time: Daily Tracking.
Imperial College COVID19 NPI modelling 16 03 2020. Could Coronavirus Cause as Many Deaths as Cancer in the U.S.? Putting Estimates in Context. The Grim Truth About the “Swedish Model” by Hans Bergstrom.