
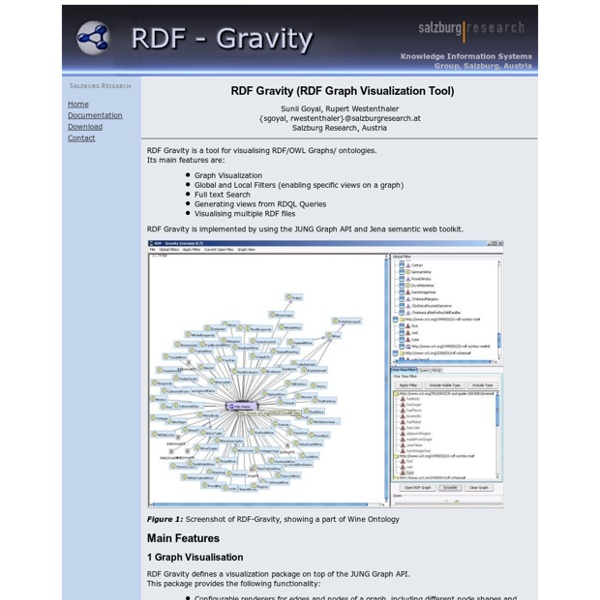
http://semweb.salzburgresearch.at/apps/rdf-gravity/index.html
Graphs and Dijkstra algorithm I wrote this article in order to share the source-code of a basic implementation of the the Dijkstra's algorithm. Readers after full-featured, industrial-strength Java implementations of Dijkstra's shortest path algorithm should look into JGL and JDSL, among others (Thanks to Renaud Waldura for the links taken from his article). Important : Update from the 04/03/2004 : there was a bug in the PriorityQueue class which was generated inaccurate results. I'd like to thank Olivier Daroux for telling me about the problem and fixing it. I have updated the source-code and it is available for download.
Graph Theory Tutorials Chris K. Caldwell (C) 1995 This is the home page for a series of short interactive tutorials introducing the basic concepts of graph theory. There is not a great deal of theory here, we will just teach you enough to wet your appetite for more! THINK - Overview Overview | People | Collaborators | Sponsors | Publications | Tools The THINK (Tactical Human Integration of Network Knowledge) project is a collaborative effort of Pearson’s Knowledge Technologies (PKT) division, Carnegie Mellon University’s Center for the Computational Analysis of Social and Organizational Systems (CASOS) and the MA&D Operation of Alion Science and Technology. The goal of the effort is to develop an integrated toolset that supports different but complementary analysis methods. The toolset addresses three inter-related aspects of human integration of networked knowledge: CMU’s tools for extracting and analyzing dynamic network structure; PKT’s tool for understanding and assessing the content of communication over a given network; and Alion’s tool for modeling and exploring network performance for given team structures, technologies and human cognitive behaviors.
Ubigraph: Free dynamic graph visualization software UbiGraph is a tool for visualizing dynamic graphs. The basic version is free, and talks to Python, Ruby, PHP, Java, C, C++, C#, Haskell, and OCaml. Download Version alpha-0.2.4 Version alpha-0.2.4 is distributed as two separate components. Watch_Dogs WeAreData In the video game Watch_Dogs, the city of Chicago is run by a Central Operating System (CTOS). This system uses data to manage the entire city and to solve complex problems,such as traffic,crime, power distribution and more... This is not fiction anymore.
Overview / Conzilla - The Concept Browser browse News 2010-10-10 Conzilla 2.3.0 released. (New collaboration backend) 2007-06-11 Conzilla 2.2.3 released. (Bugfix release) 2007-03-27 Conzilla 2.2.2 released together with Collaborilla 1.1. See the release notes for details. 2007-02-13 Conzilla 2.2.1 released. Large-scale RDF Graph Visualization Tools AI3 Assembles 26 Candidate Tools The pending UMBEL subject concept “backbone” ontology will involve literally thousands of concepts. In order to manage and view such a large structure, a concerted effort to find suitable graph visualization software was mounted.
Psychedelic Spirit Paintings, Alex Grey Art Gallery Karma Jello Cannabis, Psychedelics, Comedians, Astronomy, Philosophy, Photography, Art, MMA Karma Jello » Culture » Art » Psychedelic Spirit Paintings, Alex Grey Art Gallery Psychedelic Spirit Paintings, Alex Grey Art Gallery POSTED BY JAMES HSU | Art, Psychedelics Activity System Design Tools - KP-Lab Tools Help From KPE Tools Help This page explains how to get started with using the Activity System Design Tools software. The purpose is to show what can be done in the user interfaces and how things work from the end user's perspective. [edit] Opening ASDT within KPE
Dot2WPF - a WPF control for viewing Dot graphs. Free source code and programming articles Introduction I am presenting a WPF control for viewing graphs rendered by GraphViz (Dot). The DotViewer control has the usual navigation -- i.e. zoom, drag, scroll -- and supports hit testing on nodes, which is used for displaying tooltips. In the first place, this article should show you how easy it is to do "owner drawn graphics" in WPF. As it turns out, the viewer of this sample also has some advantages over existing viewers: Google Uses Artificial Brains to Teach Its Data Centers How to Behave A central cooling plant in Google’s Douglas County, Georgia data center. Photo: Google/Connie Zhou At Google, artificial intelligence isn’t just a means of building cars that drive on their own, smartphone services that respond to the spoken word, and online search engines that instantly recognize digital images.
Open source data structs and semantic frameworks The Open Semantic Framework is a complete and integrated software stack that combines external open source components with specific enhancements developed by Structured Dynamics. OSF is a complete foundation to bring semantic technology capabilities to the enterprise. OSF has a variety of potential applications from enterprise information integration to collaboration networks and open government. Examples of flowcharts, organizational charts, network diagrams and more Edraw provides a wide variety of examples such as flowcharts, organizational charts, business charts, UML diagrams, database and ERD, directional map, network diagrams and lots more. Please choose any examples you are interested in, alternatively download them for free. You will need to install Edraw to view them.
Volkswagen’s Use of structWSF in their Semantic Web Platform at Frederick Giasson This story has been published by Jennifer Zaino’s in her article: Volkswagen: Das Auto Company is Das Semantic Web Company! I can now talk about this project that uses some pieces of the framework that we have been developing for more than 3 years now. The Objective Volkswagen’s main objective behind the development of the next version of their Web platform started by improving their online search engine, but as William Greenly mentioned, it quickly became a strategic decision: "So the objectives were about site search and improving it, but in the long-run it was always the idea to contextualize content, to facet content, to promote it in different contexts." The objective is to create a platform that gives them the flexibility to leverage all the data assets they own.