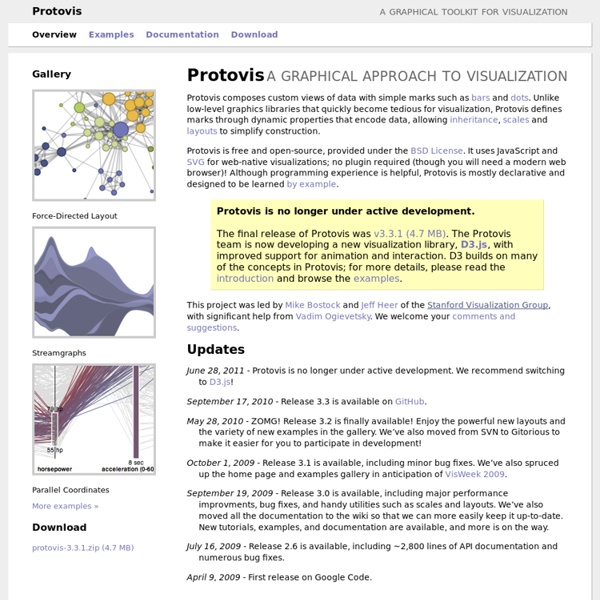
mocl: Lisp for iPhone/iOS, Android, and other mobile platforms
mocl is built around the idea that your application logic should live in Lisp, and your user interface code should be fully native to the platform — Obj-C or Java in the case of iOS and Android. This is not unlike the web, where your server logic is in one language (hopefully Lisp), and the client logic is in HTML/JavaScript. For example: We set up (using Apple's Xcode) an Objective-C event handler called onDoneTap that triggers when the 'Done' button is tapped. - (IBAction)onDoneTap:(id)sender { [[self view] endEditing:YES]; update_contact([_txtName text], [_txtMobile text], [_txtEmail text]); save_contacts(); ... When the event is triggered, our Lisp code gets called.
Desktop
This software has been renamed to Gapminder World Offline Because of technical problems the software on this page is no longer being maintained! Please visit Gapminder World Offline (Beta) instead. Gapminder Desktop
Mr.doob's blog
I think it was in 2004 when I started investigating, learning the maths and testing all this stuff of projecting 3d points into a 2d plane... Two years later, in 2006, I had a torus knot with flat shading with a light and a camera. Then Papervision3D came into the scene and I got distracted ;) Two years later, in 2008, I reworked my code with the things I liked from Papervision3D but making it simpler to my mind. At that point I was calling the engine threedoob and I did a bunch of experiments with it.
McKinsey Web 2.0 Visualization
For the past seven years, thousands of executives from around the world—across a range of industries and functional areas—have responded to a McKinsey survey on how organizations are using social (or Web 2.0) technologies. In 2009 we created an interactive tool that links the data from these survey results and charts it to the emerging trends in Web 2.0 adoption. This interactive focuses on several of the survey’s core questions—from what technologies and tools companies view as most important to what kind of investments, if any, organizations plan to make in Web 2.0 in the future.
blog » Hexbins!
Binning is a general term for grouping a dataset of N values into less than N discrete groups. These groups/bins may be spatial, temporal, or otherwise attribute-based. In this post I’m only talking about spatial (long-lat) and 2-dimensional attribute-based (scatterplot) bins. Such binnings may be thought of as 2D histograms. This may make more or less sense after what lies beneath.
Introduction to UML2 Profiles
Copyright 2004, 2008 International Business Machines Corp. Summary This article describes how to work with profiles using the UML2 plug-ins for Eclipse. In particular, it gives an overview of how to create and apply profiles (and their contents) both programmatically and by using the sample UML editor Kenn Hussey, IBM (Updated: for Eclipse 3.4; James Bruck) Prerequisites To start using UML2 (and to follow along with the example in this article), you must have Eclipse 3.4, EMF 2.4, and UML2 2.2 installed.
Venn Templates and Venn Diagram Software - Free and no download required with Gliffy Online
A Venn diagram is a simple way to represent the relationships between groups of things with a clear, visual display. Let your ideas overlap In a Venn diagram, large circles represent groups of things with a shared attribute. Areas where these circles overlap represent individuals that belong equally to both groups. For example, a Venn diagram with one circle representing things made with yeast and another representing alcoholic beverages would have an overlapping zone where you could find both beer and wine.
Examples
This example demonstrates loading of CSV data, which is then quantized into a diverging color scale. The values are visualized as colored cells per day. Days are arranged into columns by week, then grouped by month and years. Chord diagrams show directed relationships among a group of entities.
Graphical visualization of text similarities in essays in a book
Early stages in the process While developing the visualization algorithms, we plotted out a lot of different approaches that in the end we discarded for one reason or another. Here you can look at some of them. Examples of final results
About Google+ Ripples - Google+ Help
Google+ Ripples creates an interactive graphic of the public shares of any public post or URL on Google+ to show you how it has rippled through the network and help you discover new and interesting people to follow. Ripples shows you: People who have reshared the link will be displayed with their own circle.