
10 Ways to Guarantee More Sales and Conversions What’s the one thing that all businesses have in common? You guessed it, they exist to generate revenue for someone, whether it be shareholders, co-founders, or small-time owners. Of course, the issue with generating revenue is that you’re required to convert leads into customers, which is why so many startups and small businesses focus on things like compelling copy, split testing, and email campaigns. At the end of the day though, no matter how well you court a future customer, there’s really only one thing that they want, and that’s a guarantee that they’ll get something out of the purchase. Some people want results, some want gratification, and some want happiness, but at the end of the day it all boils down to one thing: avoiding regret. People simply don’t want to make a purchase that they’ll regret, and saying no is their way of avoiding just that. How do you do it? Is your guarantee good enough to do that? Standard Guarantees 1. 2. 3. 100% Satisfaction Guarantee How does it work? 4. 5.
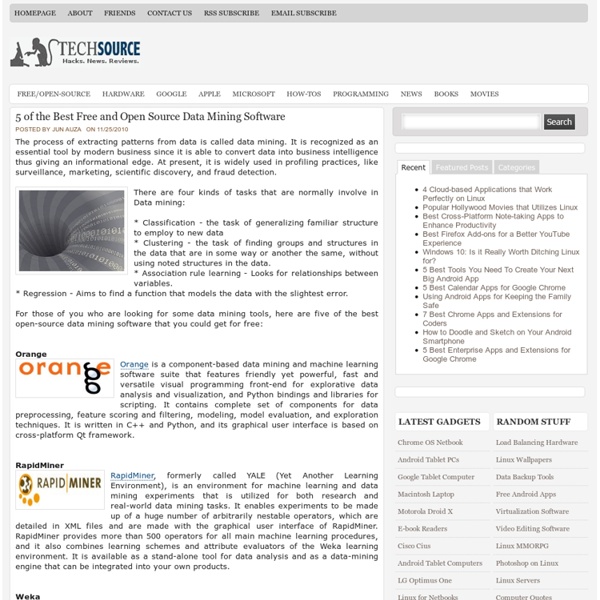
Data Mining Image: Detail of sliced visualization of thirty video samples of Downfall remixes. See actual visualization below. As part of my post doctoral research for The Department of Information Science and Media Studies at the University of Bergen, Norway, I am using cultural analytics techniques to analyze YouTube video remixes. My research is done in collaboration with the Software Studies Lab at the University of California, San Diego. A big thank you to CRCA at Calit2 for providing a space for daily work during my stays in San Diego. The following is an excerpt from an upcoming paper titled, “Modular Complexity and Remix: The Collapse of Time and Space into Search,” to be published in the peer review journal AnthroVision, Vol 1.1. The following excerpt references sliced visualizations of the three cases studies in order to analyze the patterns of remixing videos on YouTube. Image: this is a slice visualization of “The Charleston and Lindy Hop Dance Remix.”
Advanced Segmentation Triples One Brand’s Click Rate, Produces Click-To-Open Rate 2.7 Times Higher Back to Blog November 18th, 2010 by Justin Montgomery As an interesting case study to the importance of segmentation in email marketing, one brand considerably improved the success of its email campaigns by sending out over 130 versions of its newsletter. The brand, “HealthyPet,” which produces email and direct mail appointment reminders and educational content for over 4,000 veterinarians nationwide, launched its advanced segmentation campaign in January 2010, and has since seen its unique click rate triple, and its click-to-open rate go 2.7 times higher than a year ago. HealthyPet decided to segment its database by age of pet and tailor the content of its newsletters accordingly. In addition to creating specific messages depending on the age of the pet, HealthyPet also segmented its list by pet breed , since a German shepherd, for example, is likely to suffer from different health and wellness issues than a Chihuahua.
Eureqa Eureqa is a breakthrough technology that uncovers the intrinsic relationships hidden within complex data. Traditional machine learning techniques like neural networks and regression trees are capable tools for prediction, but become impractical when "solving the problem" involves understanding how you arrive at the answer. Eureqa uses a breakthrough machine learning technique called Symbolic Regression to unravel the intrinsic relationships in data and explain them as simple math. Over 35,000 people have relied on Eureqa to answer their most challenging questions, in industries ranging from Oil & Gas through Life Sciences and Big Box Retail. Eureqa One Page Overview (.pdf) »Visit the Eureqa Community » Eureqa utilizes a machine learning technique called Symbolic Regression to distill raw data into non-linear mathematical equations.
Five Unique Calls to Action that Will Make You Click Twice The call to action is the “Holy Grail” of every marketer. Get it right, and you’re swimming in sales. Get it wrong, and your traffic tends to stagnate. Address Customer Reluctance Upfront (LightCMS) LightCMS does this wonderfully, although you have to scroll all the way to the bottom of their page to find it. Think Outside the Rectangle (Storenvy) Most call to action buttons are simply rectangles, but some of the highest click-through rates have been reported on buttons that break outside the box. What Happens After I Push It? As enticing as your graphics look, many people don’t convert because they don’t know what will happen after they click. Pique the User’s Curiosity You’ve probably seen those “Weird Old Tip” ads splashed all over the internet. Although the nature of the business is borderline illegal (and certainly unethical), you can’t deny the pull that these ads have over people. Apply Continuity to Your Pages Before you think I’m trashing the concept of continuity – I’m not.
GGobi data visualization system. A Beginner's Guide to A/B Testing: Email Campaigns That Convert Email campaigns and newsletters can be a great way to get repeat business, as well as new customers. You’re already working with a somewhat pre-qualified base: these people have said they want to receive information from you. And a lot of them have likely already done business with you. And we all know it’s easier and cheaper to retain customers than it is to get new ones. This is why it’s vital to run A/B tests when trying out new techniques or formats for your email campaigns. Here’s the third installment in our A Beginner’s Guide to A/B Testing series. Decide What You’ll Test The first step in setting up an effective A/B test is to decide what you’ll test. Call to action (Example: “Buy Now!” Each of those things is likely to have an effect on different parts of the conversion process. Think about this when you’re deciding which things to test first. Test Your Whole List, Or Just Part? In the vast majority of cases, you’ll want to test your entire list. What Does Success Mean?
Graphviz Get Found using Inbound Marketing The web has forever changed people’s buying habits. Instead of needing to rely on sales people to send them information, buyers now have Google and other search engines to research products, find competitors, and see how other people rate those products in blogs and reviews. Furthermore they are greatly influenced by individuals that have emerged as experts in particular subject areas who use social media to get their messages across. This sea change in buying behavior requires vendors to re-think how they go to market, and optimize to make sure that they will get found by buyers using search engines, blogs, reviews, and social media. HubSpot produced this great humorous video that highlights the hopelessness of the old techniques in this new world: As further evidence of this change in buying behavior, I was recently talking to the CIO of a large pharmaceutical company, and he told me how he hates spam emails from vendors, and how he had developed a canned email response to them.
Flare | Data Visualization for the Web 7 Creative Ways to Get Customer Testimonials One of the most powerful pages on your website is your testimonials page. Great testimonials tell people that your product or service is not only legit, but awesome enough that other people are seeing great results from it. The question is, how do you get believable testimonials? Let’s look at some of the sites you can collect reviews upon, as well as how to encourage reviews from your customers and how to gather them from all around the web. 1. If you have a Facebook page and are setup as a local business, your page now comes with a Reviews tab. Simply slide this tab over into your visible tabs, and encourage your fans on your wall to go over and enter some reviews. 2. LinkedIn can be a great source of reviews, extracted from your recommendations. But what if you own a company with many employees? Plus, it wouldn’t hurt for someone who is researching your company on LinkedIn to see that you have an employee with an exemplary record, like the LinkedIn member above. 3. 4. 5. 6. 7.
FlowStone | Overview FlowStone uses a combination of graphical and text based programming. Applications are programmed by linking together functional building blocks called components. Events and data then flow between the links as the application executes. All this happens instantly - there's no compiling, your application runs as you build it making development an extremely rapid process. FlowStone allows you to create your own components using Ruby. This is a very modern language that is incredibly easy to pick up. The real power of FlowStone comes from modules. FlowStone can interface with a vast range of external hardware. This is one of the most powerful features of FlowStone. Once you are happy with your design running in the FlowStone environment you can simply click the export to EXE or VST buttons and your design will be wrapped up and made into a single, standalone program or plugin that you can run and distribute freely! You can try the software for seven days.
What Should You Test On Your Landing Pages For Maximum Conversions? Have you ever wondered why all your split testing is only bringing you small, incremental improvements in your conversion rate? Most website owners blindly slog along, testing tiny but noticeable changes like headlines, button color and so forth. You’ll get some results in your conversion rate, but you’ll feel as if you’re hitting a glass ceiling – that there’s really nothing else to tweak to bring about much of a difference. If that sounds like you, you’re experiencing what blogger Andrew Chen calls the local maximum. It’s the point at which your design is as effective as it’s ever going to be, and split testing different items doesn’t bring the kind of measurable results that they used to. It’s an unfortunate side effect of split testing – where designers get too bogged down in analytics and making changes that look good on a graph but do little to lift the conversion rate. What Types of Tests Can I Run? A/B Testing Multivariate Testing Choose the Strongest-Converting Pages First