
Carreira Solo. Mentimeter. PIM - Instant screencasts: Just click record. Voki Home. Internet Safety. 15 Stunning Examples of Data Visualization. Data Visualization is a method of presenting information in a graphical form.

Good data visualization should appear as if it is a work of art. This intrigues the viewer and draws them in so that they can further investigate the data and info that the graphic represents. In this post there are 15 stunning examples of Data Visualization that are true works of art. Click on the title or image for a larger view of each visualization. The Strengths of Nations Here’s an image that discusses the variations in how different nations pursue science. Madrid.Citymurmur CityMurmur tries to understand and visualize how media attention reshapes the urban space and city. Genome Jules & Jim This visual represents the relationship between characters in the movie Jules & Jim. One Week of the Guardian This is one day in a series that takes the news from one week of the Guardian newspaper, and visually represents it as a series of static visualisations.
One Week of the Guardian Leisure & Poverty Stock Data Related Posts. Visual Complexity - A visual exploration on mapping complex networks. Infografia. Origem: Wikipédia, a enciclopédia livre.
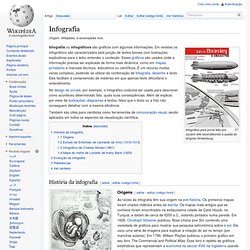
Infográfico para jornal feito por usuário wiki reconstituindo a queda do dirigível Hindenburg Infografia ou infográficos são gráficos com algumas informações. Em revistas os infográficos são caracterizados pela junção de textos breves com ilustrações explicativas para o leitor entender o conteúdo. Esses gráficos são usados onde a informação precisa ser explicada de forma mais dinâmica, como em mapas, jornalismo e manuais técnicos, educativos ou científicos.
É um recurso muitas vezes complexo, podendo se utilizar da combinação de fotografia, desenho e texto. No design de jornais, por exemplo, o infográfico costuma ser usado para descrever como aconteceu determinado fato, quais suas conseqüências. Também são úteis para cientistas como ferramentas de comunicação visual, sendo aplicados em todos os aspectos da visualização científica. História da infografia[editar | editar código-fonte] Estudos de Embriões (1510-1513) Referências. Visual thinking guides. This presents nine sources of visual thinking guides: Exploratree, Gamestorming, LexIcon, Education Oasis, TeacherVision, Freeology, Education Place and Writing Fun.
Exploratree hosts a set of interactive thinking guides. This is a free web resource where you can use the guides, print them, edit them or make your own. You can share them and work on them in groups. It is aimed at schools and students, but has ideas for thinkers of all ages. Interactive map: Flash (recommended) PDF (problem?) Here are some of the overall categories, names of individual diagram type and an indication of their purposes. Click the thumbnail to see a full-size image. Infografia. The Art of Insight and Action. Visual Understanding Environment. Visual Thinking + Synthesis. Photo by Ken Yeung I really enjoy talking complex subjects, processes or business problems and boiling them down to their core essence.

This is becoming known as the process of "Visual Thinking". I use visual metaphors and storytelling to do this. My style of visual thinking is immediately recognizable and has helped me build a strong following of influential professionals who use my visuals in their own presentations and documents. A comprehensive archive of my visuals can be found on Flickr (please credit if you use them) and if you are interested in Visual Thinking as a discipline, you can visit VizThink for additional resources. Video Lecture 11, UC Berkeley Other Courses videos.
Visual Thinking for Design. Collection: Visual thinking. 50 Great Examples of Data Visualization. Wrapping your brain around data online can be challenging, especially when dealing with huge volumes of information.

And trying to find related content can also be difficult, depending on what data you’re looking for. But data visualizations can make all of that much easier, allowing you to see the concepts that you’re learning about in a more interesting, and often more useful manner. Below are 50 of the best data visualizations and tools for creating your own visualizations out there, covering everything from Digg activity to network connectivity to what’s currently happening on Twitter.
Music, Movies and Other Media Narratives 2.0 visualizes music. Liveplasma is a music and movie visualization app that aims to help you discover other musicians or movies you might enjoy. Tuneglue is another music visualization service. MusicMap is similar to TuneGlue in its interface, but seems slightly more intuitive. Digg, Twitter, Delicious, and Flickr Internet Visualizations.