
Visualization inter-Face Ben Shneiderman A variant of the Venn diagram ( used for genre or life style visualization) A Japanese network diagram A timeline on issues in corporate communication. A timeline on issues in corporate communicatin. The famous Gartner group HypeCurve to visualize technology life cycles. www.gartner.com The Ishikawa diagram ( fishbone diagram or also cause-and-effect diagram) is a diagram, that shows the causes of a certain event. Simple color coded pyramid A bar chart, also known as a bar graph, is a chart with rectangular bars of lengths proportional to that value that they represent. Periodic table of elements A pie chart (or a circle graph) is a circular chart divided into sectors, illustrating relative magnitudes or frequencies or percents. Concept mapping is a technique for visualizing the relationships among different concepts.
TouchGraph | Products: Google Browser Use this free Java application to explore the connections between related websites. Try it now! Enter keywords or a URL, and click 'Graph it!' Getting Started Make sure you have the latest version of java, at least Java 1.5 Type in your search keywords or a URL, and press "Graph It!" Sample Searches: Heels | via Facebook Shoes Passion | via Facebook | We Heart It Facebook Also found in these collections You might like these too Log in and add tags to this image to see more things you might like! Interesting Letterhead FlowingData | Data Visualization and Statistics
200 Countries, 200 Years, 4 Minutes Mankind was able to manage many challeges in the past and can be just as successful in overcoming the new challenges facing us today. From the BBC Four program "The Joy of Stats". Want more details about a specific country? Each day the Flixxy team looks through hundreds of new videos to pull out a few we think are the best. Carte heuristique Carte heuristique dessinée pendant un exposé. Une carte heuristique[1], carte cognitive, carte mentale[2], carte des idées ou encore schéma heuristique, est un schéma supposé refléter le fonctionnement de la pensée, qui permet de représenter visuellement et de suivre le cheminement associatif de la pensée. Le terme anglais mind map est également parfois utilisé en français. Cela permet de mettre en lumière les liens qui existent entre un concept ou une idée, et les informations qui leur sont associées. La structure même d'une carte heuristique est en fait un diagramme qui représente l'organisation des liens sémantiques entre différentes idées ou des liens hiérarchiques entre différents concepts. À l'inverse du schéma conceptuel (ou « carte conceptuelle »[3]), les cartes heuristiques offrent une représentation arborescente de données imitant ainsi le cheminement et le développement de la pensée. Origine[modifier | modifier le code] Mise en œuvre[modifier | modifier le code]
10 Most Fascinating Tombs in the World There is perhaps nothing else so distinctive of the condition and character of a people as the method in which they treat their dead. - William Tegg, 1876 Throughout the history of human civilization, different cultures mourn and treat the dead differently. Some, like Tibetan Buddhists, have no use for burials as they dispose the dead by feeding corpses to vultures or by burning them in funeral pyres. Most cultures, however, show their respect by burying the dead, sometimes in complex and ornate tombs, crypts, and catacombs. This article takes a look at ten of the most fascinating final resting places around the world, from the largest prehistoric burial mound in Europe to the the tombs of pharaohs to the most beautiful mausoleum in the world: Newgrange The burial mound of Newgrange in County Meath, Ireland is definitely one of the most impressive prehistoric monuments in the world. Newgrange is impressive: the circular mound is 250 feet (76 m) across and 40 feet (12 m) high. Tana Toraja
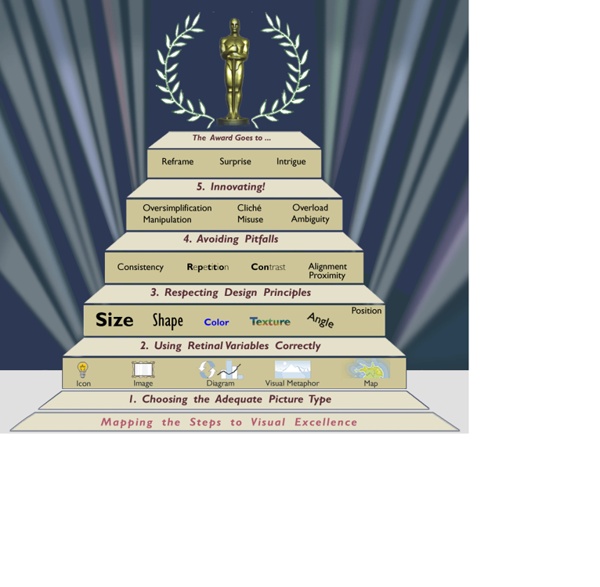
Ben Greenman’s Museum of Silly Charts Visual Thinking Spatial & Sequential Thinking Spatial and sequential thinking are two different mental organisations that affect the way people view the world. Sequential thinking is step by step linear thinking over time, while spatial thinking is an holistic system where all knowledge is interconnected in space. Auditory thinking is associated with sequential thinking and visual-spatial thinking is associated with spatial thinking. The sequential system involves analysis, progression from simple to complex, organisation of information and linear deductive reasoning. Visual-spatial thinking is the hallmark of creativity and visual spatial learners usually gravitate to the creative professions eg. art, design, architecture, computer programming, graphics, animation, physics. Traditional teaching techniques tend to be designed for auditory sequential learners. Try this simple task. A parent's viewpoint... Would you pass on my thanks to Lesley for helping our family a lot last night. Further information
15 examples Data Visualization is a method of presenting information in a graphical form. Good data visualization should appear as if it is a work of art. This intrigues the viewer and draws them in so that they can further investigate the data and info that the graphic represents. In this post there are 15 stunning examples of Data Visualization that are true works of art. Click on the title or image for a larger view of each visualization. The Strengths of Nations Here’s an image that discusses the variations in how different nations pursue science. Madrid.Citymurmur CityMurmur tries to understand and visualize how media attention reshapes the urban space and city. Genome Jules & Jim This visual represents the relationship between characters in the movie Jules & Jim. One Week of the Guardian This is one day in a series that takes the news from one week of the Guardian newspaper, and visually represents it as a series of static visualisations. One Week of the Guardian Leisure & Poverty Stock Data Related Posts
TopicMaps.Org Home Page Eco-village Coopérative d'habitat convivial - village éco-spirituel - Ecologie des relations, écologie de l'argent, écologie de l'environnement L'émergence de la conscience écologique remet en cause l'individualisme forcené de ces dernières décennies. Nous prenons la mesure de notre communauté de destins et de notre responsabilité envers le vivant sous toutes ses formes. Une frange croissante de la population explore un nouvel art de vivre, avec la volonté assumée de transformer la société en commençant par se transformer soi-même. Redonner de la valeur à l'être plutôt qu'à l'avoir, à la coopération plutôt qu'à la compétition, à la préservation plutôt qu'à la prédation de la nature, ce changement est à l'origine d'innovations dans tous les domaines: éducation alternative, écoconstruction, covoiturage, agroécologie, économie sociale et solidaire. Patrick Viveret, philosophe En Afrique aussi: Nouveautés - Quoi de neuf - What's new - Was gibt's Neues - Que contas de nuevo The Ecovillage Model La Poudrière