
The Internet of Things - a primer. Disney Strategy Chart. Source Code Infographic on Behance. Understanding the movie "Source Code" with two images – Romain Vuillemot. [SPOILER ALERT: contains some movie plot infos] I recently watched the 2011 movie Source Code, in which Jake Gyllenhaal is trapped in the body of a man riding a train about to explode.

The plot reminded me of Twelve Monkeys, where a hero is also relentlessly struggling to change history, across a long series of failures. Both movies share in-between sequences, where the hero has to report what he did and is briefed on how to do better next time. One difference -among many- being that Source Code repeats more often and with more visually similar sequences, than Twelve monkeys (which contain many more ellipses). The repetitive nature of Source Code resonates with one of my experimental project: Watching Multiple Videos at Once. I was literarily stunned by their narrative power of this collage. The collage on the left (beginning) shows how each repetition starts (read left to right, top to bottom): This is explained by the movie’s structure. What do you think? Duncan Jones’ Production Doodle Explains ‘Source Code’ Duncan Jones‘ Source Code hit Blu-ray and DVD a few short weeks back and while most film nerds have exhausted any talk of the film’s ending, more and more people are now discovering the movie.
Seems like the perfect time for the director to take to Twitter and post a drawing he did during production that attempts to visually explain the film’s structure, ending and subtle changes. Obviously, there are major Source Code spoilers after the jump. Thanks to Rope of Silicon for the heads up on this drawing, which originated at Duncan Jones’ Twitter. Basically this is the much more complicated version of Doc Brown’s explanation of the alternative, Biff-Co 1985 in Back to the Future 2 where time veers off into alternate realities. As far as I can tell, this actually changes my interpretation of the movie. I haven’t taken math in about a decade so maybe I’m wrong in my interpretation. Cool Posts From Around the Web: What Makes A Good Data Visualization? Hi there.
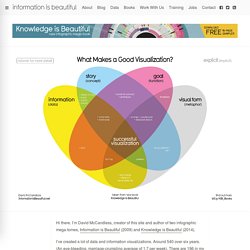
I’m David McCandless, creator of this site and author of two infographic mega-tomes, Information is Beautiful (2009) and Knowledge is Beautiful (2014). I’ve created a lot of data and information visualizations. Around 540 over six years. (An eye-bleeding, marriage-crumpling average of 1.7 per week). There are 196 in my new book, Knowledge is Beautiful (out now). This graphic visualises the four elements I think are necessary for a successful “good” visualization. i.e. one that works. All four elements in his graphic seem essential. See how, interestingly, if you combine information & function & visual form without story, you get “boring”. Similarly, if you combine visuals, information & story without considering functionality and your goal, you get something useless. These elements form the backbone of my process and also what I teach in my dataviz workshops. Information is Beautiful.
Books. Visual Thinking. What is Visual Thinking?
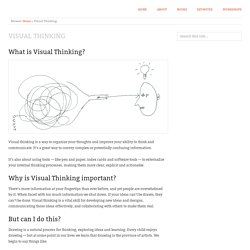
Visual thinking is a way to organize your thoughts and improve your ability to think and communicate. It’s a great way to convey complex or potentially confusing information. It’s also about using tools — like pen and paper, index cards and software tools — to externalize your internal thinking processes, making them more clear, explicit and actionable. Why is Visual Thinking important? There’s more information at your fingertips than ever before, and yet people are overwhelmed by it.
But can I do this? Drawing is a natural process for thinking, exploring ideas and learning. “I’m no artist” “I can’t draw a straight line” “I can’t draw a stick figure” This is a fallacy. Don’t believe me? Visual Thinking basics In this 20-minute video I share some basics of visual thinking that will get you up and running in about 20 minutes. How to know what to draw Visual thinking reading list.
Untitled. TOOLS_PROVENANCE.jpg (JPEG Image, 2500 × 1727 pixels) - Scaled (40%) Tools.