
Horn-HomePageStanford. Robert E.
HornVisiting ScholarProgram on People, Computers, and Design Center for the Study of Language and Information Stanford University tel. /fax 415 775 7377 hornbob@earthlink.netHome Recent Speeches & Papers Analysis and Design of Information for Complex Social Messes-Case Study - UK Energy and Climate Change Policy, MediaX Stanford University, 2007 Part 1 (PowerPoint) Part 2 (PowerPoint) Interactive Mural of the History of the Ideas of Cybernetics and General Systems, 2006 (PDF) Connecting the Smudges-How Analytic Info-Murals May be of Help in Dealing with Social Messes. Current ProjectsNew Maps for Public Policy Project Project: Mental Health Services Dynamics & Dilemmas Map (PDF) Project: National Missile Defense (PDF) Project: Alameda Long Term Care Integration: Problems and Issues Map (PDF) The Struggle of Narratives--Attempting to Visualize It Discriminate Force--Attempting to Visualize It The Argumentation Mapping Project Horn, R.
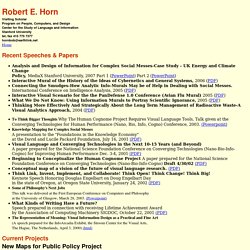
Horn, R. Horn, R. Horn, R.E. Books Horn, R. Home. Nux3000105 2. Dialogue Mapping. The icons represent the basic elements of the Dialogue Mapping™ grammar (called IBIS): Questions, Ideas, Pros and Cons.
This is a very simple map, meant to convey the basics of IBIS. In real meetings and projects the maps are much larger, more complex, and can be nested deeply. Here's an example of some larger maps from a 2-day strategic planning meeting: This combination of (i) a shared hypertext display, (ii) a trained facilitator, and (iii) a conversational grammar is Dialogue Mapping™. (For a detailed narrative of a Dialogue Mapping™ session, see "The Dialogue Mapping™ Experience".)
In Dialogue Mapping™, as the conversation unfolds and the map grows, each person can see a summary of the meeting discussion so far. Some Benefits of Dialogue Mapping™ include: Each participant's contribution is heard and acknowledged in the map. Each participant can see how their comments relate to others. The shared display map shifts the dynamic of the group into a collaborative mode ... Articles · think in colour.
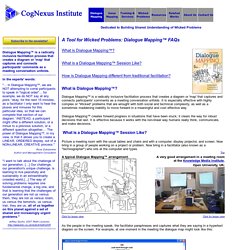
Six Golden Eggs of Graphic Recording · think in colour. May 28, 2015 The article below was written for ArtsHub, published 28.05.15 “Graphic Recording” describes the process of visually capturing and organising information in a meaningful and engaging way (using drawings, typography, shapes and text), in real time.
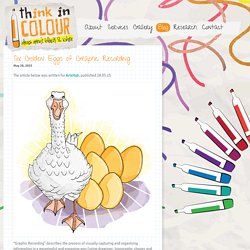
While Graphic Recording can be useful pretty much anywhere people are talking, it is most often used at conferences, workshops and consultations. More than just pictures, the process is a powerful tool for analysis, dialogue, problem solving, decision-making, brainstorming, and planning. Visual Facilitation enables the visual dialog in your workshop Marcel van Hove. My name is Mirjam Stamm.
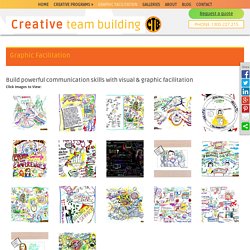
I am the CEO of Copra System GmbH based in Berlin and Sasbachwalden. Copra System GmbH develops documentation software for the anesthesia and intensive care area of hospitals. In August 2010 we contacted it-agile GmbH and got in contact with Marcel van Hove. From September 2010 until end of December 2011 Marcel worked as a Scrum consultant at Copra System GmbH. Visual & Graphic Facilitation Training. Build powerful communication skills with visual & graphic facilitation Click Images to View:
Loosetooth.com = Brandy Agerbeck = I speak, teach and write about drawing as your best thinking tool. Think tanks and data visualisation: Opening new spaces for communication and research. [Editor’s Note: This blog was written by Oriol Farrés, Project Manager at CIDOB, Barcelona Centre for International Affairs for the On Think Tanks Data Visualisation Competition.
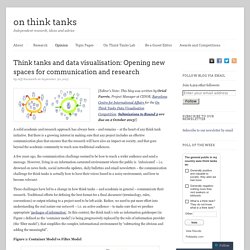
Submissions to Round 2 are due on 2 October 2013!] A solid academic and research approach has always been – and remains – at the heart of any think tank initiative. But there is a growing interest in making sure that any project includes an effective communication plan that ensures that the research will have also an impact on society, and that goes beyond the academic community to reach non-traditional audiences. A few years ago, the communication challenge seemed to be how to reach a wider audience and send a message. These challenges have led to a change in how think tanks – and academia in general – communicate their research. Figure 1: Container Model vs Filter Model. TOOLS_PROVENANCE.jpg (JPEG Image, 2500 × 1727 pixels) - Scaled (40%) Tools. Visualisations — UrbanIxD. Visual Thinking. What is Visual Thinking?
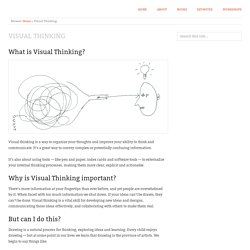
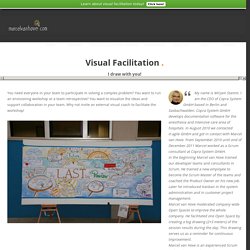
Visual thinking is a way to organize your thoughts and improve your ability to think and communicate. It’s a great way to convey complex or potentially confusing information. It’s also about using tools — like pen and paper, index cards and software tools — to externalize your internal thinking processes, making them more clear, explicit and actionable. Why is Visual Thinking important? There’s more information at your fingertips than ever before, and yet people are overwhelmed by it. But can I do this?
Drawing is a natural process for thinking, exploring ideas and learning. “I’m no artist” “I can’t draw a straight line” “I can’t draw a stick figure” This is a fallacy. Don’t believe me? Visual Thinking basics In this 20-minute video I share some basics of visual thinking that will get you up and running in about 20 minutes. How to know what to draw Visual thinking reading list.