
Petl - Extract, Transform and Load (Tables of Data) — petl 0.17-SNAPSHOT documentation. Petl is a Python package for extracting, transforming and loading tables of data.
Introduction¶ Installation¶ This module is available from the Python Package Index. On Linux distributions you should be able to do easy_install petl or pip install petl. On other platforms you can download manually, extract and run pythonsetup.py install. Dependencies and extensions¶ This package has been written with no dependencies other than the Python core modules, for ease of installation and maintenance. Conventions - row containers and row iterators¶ This package defines the following convention for objects acting as containers of tabular data and supporting row-oriented iteration over the data. A row container (also referred to here informally as a table) is any object which satisfies the following: implements the __iter__ method__iter__ returns a row iterator (see below)all row iterators returned by __iter__ are independent, i.e., consuming items from one iterator will not affect any other iterators.
Case Study 1 - Comparing Tables — petl 0.17-SNAPSHOT documentation. This case study illustrates some of the petl functions available for doing some simple profiling and comparison of data from two tables.
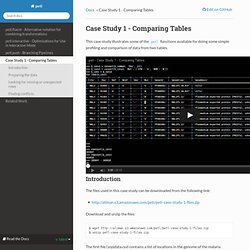
Introduction¶ The files used in this case study can be downloaded from the following link: Download and unzip the files: $ wget $ unzip petl-case-study-1-files.zip The first file (snpdata.csv) contains a list of locations in the genome of the malaria parasite P. falciparum, along with some basic data about genetic variations found at those locations. The second file (popdata.csv) is supposed to contain the same list of genome locations, along with some additional data such as allele frequencies in different populations. The main point for this case study is that the first file (snpdata.csv) contains the canonical list of genome locations, and the second file (popdata.csv) contains some additional data about the same genome locations and therefore should be consistent with the first file.
Preparing the data¶ Inspect the data: Statistical Data Analysis in Python, SciPy2013 Tutorial, Part 1 of 4. Scikit-learn. Python data tools just keep getting better. Here are a few observations inspired by conversations I had during the just concluded PyData conference 1 .
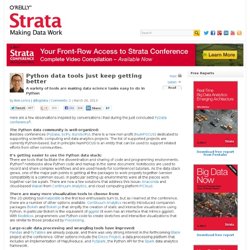
The Python data community is well-organized: Besides conferences ( PyData , SciPy, EuroSciPy ), there is a new non-profit ( NumFOCUS ) dedicated to supporting scientific computing and data analytics projects. The list of supported projects are currently Python-based, but in principle NumFOCUS is an entity that can be used to support related efforts from other communities. It’s getting easier to use the Python data stack: There are tools that facilitate the dissemination and sharing of code and programming environments.
IPython 2 notebooks allow Python code and markup in the same document. Notebooks are used to record and share complex workflows and are used heavily for (conference) tutorials. Large-scale data processing and wrangling tools have improved: Pandas and PyTables are already popular, and there was very strong interest in the forthcoming Blaze project at the conference. Machine Vision made Easy - SimpleCV. Blaze - Continuum Analytics. Pyplot tutorial. Matplotlib.pyplot is a collection of command style functions that make matplotlib work like MATLAB.
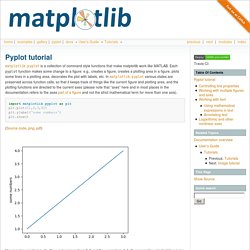
Each pyplot function makes some change to a figure: e.g., creates a figure, creates a plotting area in a figure, plots some lines in a plotting area, decorates the plot with labels, etc. In matplotlib.pyplot various states are preserved across function calls, so that it keeps track of things like the current figure and plotting area, and the plotting functions are directed to the current axes (please note that “axes” here and in most places in the documentation refers to the axespart of a figure and not the strict mathematical term for more than one axis). import matplotlib.pyplot as pltplt.plot([1,2,3,4])plt.ylabel('some numbers')plt.show() (Source code, png, pdf) You may be wondering why the x-axis ranges from 0-3 and the y-axis from 1-4.
Plot() is a versatile command, and will take an arbitrary number of arguments. Plt.plot([1, 2, 3, 4], [1, 4, 9, 16]) (Source code, png, pdf) Nbviewer.ipython.org/urls/raw.github.com/CamDavidsonPilon/Probabilistic-Programming-and-Bayesian-Methods-for-Hackers/master/Chapter1_Introduction/Chapter1_Introduction.ipynb. Neuroimaging in Python — NIPY Documentation.