
The Future of Infographics: Make it Interactive. Statistical Graphics vs. InfoVis. The current issue of the Statistical Computing and Graphics Newsletter features two invited articles, which both look at the “graphical display of quantitative data” – one from the perspective of statistical graphics, and one from the perspective of information visualization.
Robert Kosara writes from an InfoVis view: Visualization: It’s More than Pictures! Information visualization is a field that has had trouble defining its boundaries, and that consequently is often misunderstood. It doesn’t help that InfoVis, as it is also known, produces pretty pictures that people like to look at and link to or send around.
But InfoVis is more than pretty pictures, and it is more than statistical graphics. The key to understanding InfoVis is to ignore the images for a moment and focus on the part that is often lost: interaction. . … read on in the Newsletter. An Intimate Look at Infographics. Infographics Help Decision-Making Process. Filed under: All Infographics, Business Infographics | 2 Comments » Okay, a little self-promotion here.
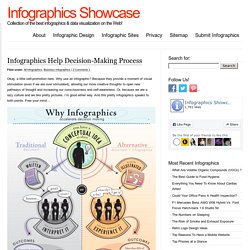
Why use an infographic? Because they provide a moment of visual stimulation (even if we are over stimulated), allowing our more creative thoughts to open new pathways of thought and increasing our consciousness and self-awareness. What’s Next for the Infographic? Now that everyone knows what they are, forward thinkers are wondering what’s next for the infographic. Is this the beginning of a visual revolution, or is it another passing fad?
This is an important question to consider particularly for those who are making large investments in the medium. Are Infographics Dead? Ross Crocks of Column Five Media attempts to answer this very question. How infographics jumped the shark. We’ve tumbled headlong into the era of infographics.
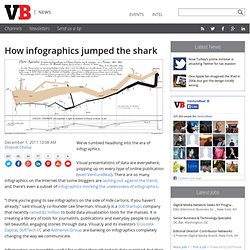
Visual presentations of data are everywhere, popping up on every type of online publication (even VentureBeat). There are so many infographics on the Internet that some bloggers are lashing out against the trend, and there’s even a subset of infographics mocking the uselessness of infographics. “I think you’re going to see infographics on the side of milk cartons, if you haven’t already,” said Visual.ly co-founder Lee Sherman. Visual.ly is a 500 Startups company that recently raised $2 million to build data visualization tools for the masses. It is creating a library of tools for journalists, publications and everyday people to easily tell beautiful, engaging stories through data. Ending the Infographic Plague. Now that Obama's dog has won the War on Christmas, or something, it's time to get down to a war that really matters: the war on terrible, lying infographics, which have become endemic in the blogosphere, and constantly threaten to break out into epidemic or even pandemic status.
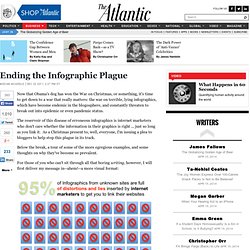
The reservoir of this disease of erroneous infographics is internet marketers who don't care whether the information in their graphics is right ... just so long as you link it. As a Christmas present to, well, everyone, I'm issuing a plea to bloggers to help stop this plague in its track. Below the break, a tour of some of the more egregious examples, and some thoughts on why they've become so prevalent. Onextrapixel - Web Design & Development Magazine. Infographics (or information graphics) are everywhere these days.

Intended to deliver large amounts of information in a visual format, the key to a ‘good’ infographic is the story it tells. From a user’s perspective, the value from an infographic comes from the information it contains and the way in which it’s presented. Infographic of infographics. Infographic on infographics ;) ++ How Pop Chart Lab Made That Amazing Apple Infographic. Robby Stein remembers when Kevin Systrom was just another startup guy, who’d created a photo sharing app called Instagram.

They knew each other working at Google. Systrom’s idea for the thing was all around instant sharing—to capture fleeting moments, like a dog you met or going to the park. "People would comment, and then you’d have a conversation," recalls Stein. And yet a funny thing happened on Instagram’s march to 500 million users. The photo service that had been meant to be instant morphed into something less like a stack of polaroids and more like museum catalogue. They had seemed like such an obvious thing to add. The solution was Instagram Stories, a way of quickly sharing videos and pictures that disappear after 24 hours. Different Space Means Different Rules Instagram revolves around the story feed—a stream of images and captions that users scroll past. Piquant : l'infographie qui se moque des infographies. Vous le savez, les infographies sont à la mode sur le web.
C’est souvent joli, bien fait, informatif et bâti sur le fameux et vieux principe disant qu’une image vaut mille mots, tout ça. Vous le savez, les infographies sont à la mode sur le web. Une infographie… sur les infographies. L art de la retrographie. La représentation graphique des données, une manière d'appréhender le monde qui ne date pas d'hier. Excursion dans l'infographie du début du siècle dernier, avec David MacCandless, d'Information is beautiful.
ENQUETE BLOGOSPHERE FRANCOPHONE 2010. Chose promise, chose due, voici les résultats de la 4ème édition de la traditionnelle Enquête Blogosphérique organisée chaque année par NWE!

Les meilleures infographies du web. En une seule minute, une quantité monstrueuse de données est échangée sur le web.
Chaque minute de chaque heure de chaque journée. Infographies. Ces derniers temps la mode des infographies semble gagner du terrain, et il est vrai que souvent une belle image vaut mieux que de beaux discours, puisqu’un seul coup d’œil suffit pour appréhender la situation.

Donc même si certains pensent que les infographies pourrissent Internet, j’en ai choisi dix récentes, qui vont des réseaux sociaux à Twitter en passant par LinkedIn, de l’iPhone aux procès pour Androïd, de l’historique des navigateurs au CV infographie… Visually Launches To Automate The Making Of Infographics. The whiz kids behind Mint’s infographics, Stewart Langille and Lee Sherman are today launching the first startup that solely focuses on mass producing infographics, Visually. Users who visit Visually this morning can see over 2000 infographics uploaded by designers like Jess3 and Dave McCandless as well as upload their own in a myriad of topics ranging from Science to Sports to the Economy. In its first launch iteration, Visually has partnered up with The Atlantic, GOOD Magazine CNNMoney.com, Ebay, The National Geographic and others to provide infographics content in exchange for sharing links — On Visually each participating publication gets to upload its own graphics, which are embedded and shared using an code generated by Visually.
Visually plans on monetizing eventually by letting publications subscribe to its offerings via a monthly fee. The duo have almost 500K in seed funding to make this dream come true. The Making of an Infographic: The Content Grid v2 - Jesse Thomas - JESS3. Infographics as a Creative Assessment.