
The Modern Marketer #Infographic. Adrants : Infographic Examines Evolution... Infographic Examines Evolution of Big Brand Logos. Ah, yes.
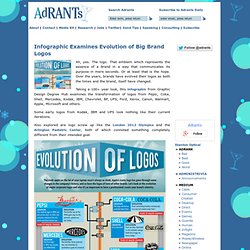
The logo. That emblem which represents the essence of a brand in a way that communicates its purpose in mere seconds. Or at least that is the hope. Over the years, brands have evolved their logos as both the times and the brand, itself have changed. What Are The Top 10 Social Media Tools And The Top 10 Tools For Monitoring For Content Opportunities And Trends. What Are The Top 10 Social Media Tools And The Top 10 Tools For Monitoring For Content Opportunities And Trends?
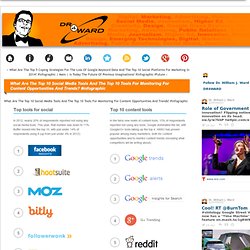
#infographic Moz Guest post by Yin Wu I look 4Ward to your feedback. Keep Digging for Worms! Author: Bill - Dr. DR4WARD enjoys helping connect students and pros to learn about all forms of communication and creativity. A Look at How Many People Keep Their New Year’s Resolutions to Get Fit. Why Social Recruitment Works. How Your Clothes Might Be Hurting Your Body (INFOGRAPHIC) When it comes to keeping up with the trends, we all seem more than willing to suffer for fashion.

Painful stilettos? No problem. Jeans that require a gym membership to peel off? Child's play. The 21 Best Infographics Of 2013. One of the basic laws of quantum mechanics is that information can never entirely be lost, only assume other forms.
One of the most exciting forms information can take is that of the infographic, and over the past 12 months, Co.Design has covered some of the prettiest, most innovative design permutations information can take as part of our Infographic Of The Day series. Over the course of the year, we saw infographics on a wide range of subjects, including 20th-century camera and sneaker design, house alliances of The Game Of Thrones, a colorwheel of cheeses, undersea internet cabling, beard typography, Batman symbols, and much, much more. For years, marketers without a lick of design sense were slapping clip art on any data set that came their way and calling the finished poster an infographic. In 2013, there was a backlash against shoddy infographics. Black Friday Is Moving Forward as Shoppers Start on Thanksgiving.
Vanityfair. In Lisa Robinson’s November story, “Jay Z Has the Room,” the rapper turned mogul opens up about his long résumé as a “son, brother, husband, father, entrepreneur, mogul, sports agent, rapper, performer, movie producer, author, nightclub owner, Broadway producer, festival organizer, watch designer, soundtrack and video-game executive producer, and art collector.”
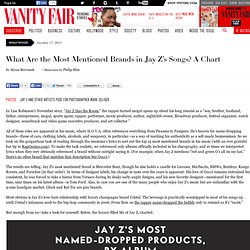
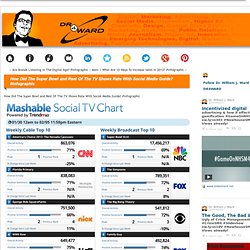
All of these roles are apparent in his music, where H.O.V.A. often references everything from Picassos to Pampers. He’s known for name-dropping brands—those of cars, clothing labels, alcohols, and weaponry, in particular—as a way of marking his authenticity as a self-made businessman. So we took on the gargantuan task of reading through the musician’s lyrics to sort out the top 15 most mentioned brands in his music (with an ever grateful hat tip to RapGenius.com). The results are telling. Most obvious is Jay Z’s love-hate relationship with luxury champagne brand Cristal. Infographic: Which fall shows generated the most social TV buzz this summer? Improve Your Facebook Page Using The Hasbro Classic ... How Are Different Social Media Platforms Like Drugs? ... What Are Some Dos And Don'ts Of Mobile App Marketing? ... How to design a hipster logo.
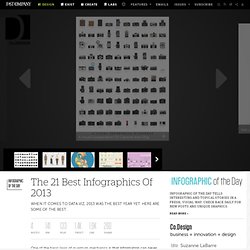
The Best and Worst Times to Post to Social Media [Infographic] The Best and Worst Times to Post to Social Media [Infographic] When To Post To Get Seen!
![The Best and Worst Times to Post to Social Media [Infographic]](http://cdn.pearltrees.com/s/pic/th/worst-times-social-infographic-61155570)
Getting seen on social media can be tricky so it helps to be aware of times that improve your chances! This does need a disclaimer however and that’s that these are generalized times and not all markets perform the same. You ALWAYS should be doing your own testing. Optimizing your posting times can greatly improve the EdgeRank of your Facebook Page. That said though, these can be great starting points. Lori Taylor from Social Caffeine provides us with this handy infographic to get us started on the right path. Facebook: Traffic is highest between 9 a.m. and 4 p.m. Best time: Between 1 p.m. and 4 p.m. Social Media Wars Told in 'Game of Thrones' Style [INFOGRAPHIC] Classic What Would Don Draper Do? #MadMen #infographic #flowchart. Classic What Would Don Draper Do?

#MadMen #infographic #flowchart Source: The Oatmeal. A Deep Dive into the Internet Meme [Infographic] Internet memes are cultural ideas that spread virally throughout the Web.
![A Deep Dive into the Internet Meme [Infographic]](http://cdn.pearltrees.com/s/pic/th/internet-infographic-memes-50116091)
In 2012, these Internet pop culture snippets rapidly rose in popularity and power as they captured the moments that got everyone talking, tweeting, mocking, and rocking. To recall the most memorable memes of the year, MDG Advertising developed an entertaining infographic featuring the four Internet memes that took over the Web and the world. It offers a look at the photos and videos that caught our attention and explains why these moments became iconic images of our time. How Did The Super Bowl and Rest Of The TV Shows Rate With Social Media Guide.
How Did The Super Bowl and Rest Of The TV Shows Rate With Social Media Guide?
#infographic. The Usual Clients infographic - Central Desktop. Check out our blog and resource library for more collaboration best practices.
Infographics / Creating a Superior Web Strategy #infographic. The Dollars and Senselessness of Political Campaigning [Interactive Infographic] The Evolution of Digital Advertising. Are Books Doomed? The Rise of the e-Reader [INFOGRAPHIC] The tactile pleasure of worn pages between your fingers is hard to replace. But when it comes to encouraging people to embrace the written word, e-readers trump their physical counterparts. According to the infographic below, people who own e-book devices say they read more than people who don't, at a rate of 24 books per year to 15.
Education, escape, relaxation and entertainment rank as people's main motivations to plow through books — proving that, whether electronically or via dead tree, reading remains a popular pastime. Infographics / An #Infographic About Infographics. Film & Music That I Like. / What Your Band T-Shirt Says About You [Infographic] » Clutch Blog. What Facebook Can Tell Us About Olympics Fans [INFOGRAPHIC] Olympics fans like sports. But what do they Like? Facebook — who else?
— holds many interesting insights there. Social media advertising company Compass Labs recently analyzed Facebook fans of the official Olympic Games and U.S. Olympic Team pages to compile some revealing profiles of how the two groups match up. Overall, the two pages corral similar demographics. U.S. fans list track and field as their top sport, but it's just eighth among overall Olympics aficionados.
When it comes to brand loyalty, fans of The Olympic Games tend to be a bit more worldly with their biggest favorites than fans of the U.S. US Olympic Team fans' most-like brand, according to Compass Labs? Check out the full Compass Labs report below. Thumbnail image courtesy of iStockphoto, cmannphoto. Fitness / Why Coffee and Tea are Amazing for You #infographic hollaaaa. Infographics / Money in the food industry #infographic. Infographics / Best jobs in America. Too late to rethink my major ? #infographic. Infographics / #socialmedia vs. Traditional Media. #marketing #webmarketing #infographic.
Infographics / The rise and fall of advertising media #infographic. Where do ideas come from INFOGRAPHIC « Newhouse Ad Creative. The State of Social Media Around the World 2010 Brian Solis. How Recruiters Use Social Networks to Screen Candidates. Over the past few years, we've seen social media used in the job market in a number of ways — startups, small businesses and large corporations alike are diving into the socialverse to find top talent, and job seekers are likewise getting creative with social media. Social media monitoring service Reppler recently surveyed more than 300 hiring professionals to determine when and how job recruiters are screening job candidates on different social networks.
The study found that more than 90% of recruiters and hiring managers have visited a potential candidate's profile on a social network as part of the screening process. And a whopping 69% of recruiters have rejected a candidate based on content found on his or her social networking profiles — an almost equal proportion of recruiters (68%), though, have hired a candidate based on his or her presence on those networks. How Not To Make An Infographic.