
Infogr.am. Create and share visual ideas online. Text, Images, Music and Video. Collaborative Online Diagram Software - Try it Free. GunnMap 2. Tagxedo - Word Cloud with Styles. Online Diagram Software and Flowchart Software - Gliffy. Online Communities. Intersect this! “Intersection” The Intersection design is a Venn diagram with two overlapping circles - you control what is in the circles and (just as importantly) what lies between.
If you have trouble on an older computer, try using an alternative version. This is a 400x300 design, with 800x600 available to subscribers. There are related designs available. Options Problems? Related designs About this design This design is by paulfitz. StatPlanet Map Maker – Data Visualization and Mapping Software.
For a shorter video, see Create an interactive map in 60 seconds Contents of StatPlanet_Map_Maker.zip: Docs - User Guide (User_Guide_StatPlanet.pdf) - StatPlanet Map Maker Software License (License_Terms.pdf) World_Map - Create interactive maps using the included World Map.
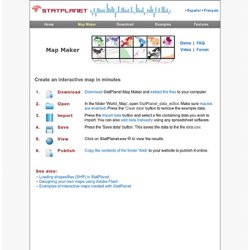
USA_Map - Create interactive maps using the included USA Map. Custom_Map - Design or import a map using the map template (map.fla). (requires Adobe Flash CS3 or higher) - Includes an example map (map_example.fla), a province map of Kenya. Publish your data visualizations online: To publish StatPlanet Map Maker online , all you need to do is to upload the contents of the folder Web to the website (web-server). Enable macros in Excel: When you open StatPlanet_Data_Editor.xls you will normally get a message asking you whether you wish to enable macros. Excel 2007 or newer: In the top of the screen, next to 'Security Warning', click the button 'Options'. See also these Excel help pages for Excel 2007 or Excel 2003 . Inkscape. Draw Freely.
Download Tableau Public. StatPlanet Map Maker – Interactive Mapping & Visualization Software. Public Data Explorer. Online Charts Builder. Hohli Online Charts Builder New version: Try new version of Charts Builder, it based on new Google Charts API Load From Image URL: Chart Data can't equal to original, but very similar to it.

Only for images on chart.apis.google.com Chart Type: 3D Pie charts Lines Bar charts Pie charts For Pie Charts with labels choose 1000x300 or 800x375 size Venn diagrams Scatter plots Radar charts Chart Size: 320x240 Horizontal 1000x300 800x375 600x500 320x240 Vertical 300x1000 375x800 500x600 240x320 Square 546x546 400x400 300x300 200x200 Chart Ads: Data: Should be consists only positive numbers, use minus one (-1) for missing value, separated by coma, space or semi(,; ), e.g.: 23, 432, 456, 341 For Lines (pairs): Input data as x-axis and y-axis coordinates, e.g.: x1,y1, x2,y2, x3,y3 Title: Use a pipe character (|) to force a line break in title. Background: Chart is ready you can save it as image Right click on the chart Select "Save image as" Save the image to your computer © 2011 Charts Builder. Developed by Anton Shevchuk.