
The Event Visualization Tool (eVis) The Center for Biodiversity and Conservation's Biodiversity Informatics Facility at the American Museum of Natural History strives to utilize information technologies in biodiversity research and applications while developing and promoting the effective use of these technologies for the conservation of biodiversity.
The Biodiversity Informatics Facility is accomplishing this goal largely through the use and development free and open source resources. The Center for Biodiversity and Conservation is undertaking several projects in Vietnam's Annamite region and at selected sites in Lao People's Democratic Republic with the overarching goal of conserving the unique biodiversity within these regions. In May 2007, CBC Staff traveled to Vietnam and the Lao People's Democratic Republic to train conservation practitioners in incorporating geospatial technologies into their biological and ecological monitoring activities. Plugins Repository. !
<tl><dr> Local Authorities work with people and assets. Most people have an address and assets are mostly located somewhere. As my old geography teacher used to say, “everything has geography, geography is everything”. For people who work in Local Authorities being able to find an accurate and up-to-date address easily is key to being able to deliver a service quickly and efficiently.
At the recent AGI GeoCom and FOSS4G conferences in Nottingham during Maptember QGIS 2.0 was launched and garnered a lot of attention from people interested in finding solutions to save money and time and still deliver great results. QGIS fitted the bill with its extensive range of functionality, growing list of available plugins, super easy connectivity to a range of data sources including Oracle, SQL Server and PostGIS, all of which we use.
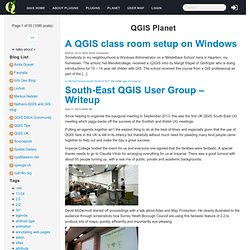
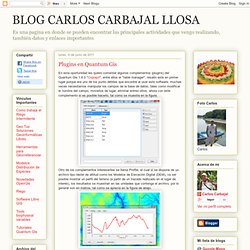
Enter the QGIS Gazetteer Plugin developed by Astun Technology, Nathan Woodrow and Matt Walker. What you need: 1. QGIS Workshop. BLOG CARLOS CARBAJAL LLOSA: Plugins en Quantum Gis. En esta oportunidad les quiero comentar algunos complementos (plugins) del Quantum Gis 1.6.0 "Copiapó", entre ellos el "table manager", resalto este en primer lugar porque era uno de los punto débiles que encontré al usar este software, muchas veces necesitamos manipular los campos de la base de datos, tales como modificar el nombre del campo, moverlos de lugar, eliminar entreo otros, ahora con este complemento si es posible hacerlo, tal como se muestra en la figura.
1-band raster colour table. This QGIS plugin is used to create a colour table for a one-band raster file.
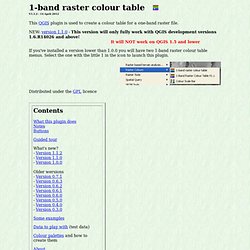
NEW: version 1.1.0 - This version will only fully work with QGIS development versions 1.6.R14026 and above! Qgis - How to install "1-band color raster color table" I am using QGIS 1.8 Lisboa so I do not know if the "1-band raster colour table" plugin works on 1.7.4 (I did not use it on 1.7), but you can try this on 1.7.4 and see what happens.
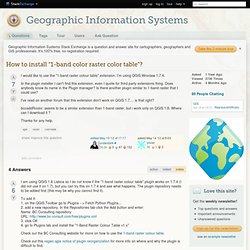
The plugin repository needs to be added first (this may be why you cannot find it). To add it: 1. on the QGIS Toolbar go to Plugins --> Fetch Python Plugins... 2. add a new repository. In the Repositories tab click the Add button and enter: Name: BC Consulting repository URL: 3. click OK 4. go to Plugins tab and install the "1-Band Raster Colour Table v1.x" Check out the BC Consulting website for more on how to use the 1-band raster colour table. Check out this osgeo qgis notice of plugin reorganization for more info on where and why the plugin is difficult to find. You also might want to try the "One-band raster to paletted or RGB raster" plugin.
Edit: The BC Consulting webpage says that this works with 1.6 and above, so it should work with 1.7.4. Written by Anita Graser aka Underdark. Data-defined properties in QGIS 2.0. In QGIS 2.0, the old “size scale” field has been replaced by data-defined properties which enable us to control many more properties than jut size and rotation.
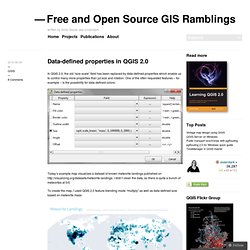
One of the often requested features – for example – is the possibility for data-defined colors: Today’s example map visualizes a dataset of known meteorite landings published on I didn’t clean the data, so there is quite a bunch of meteorites at 0/0. To create the map, I used QGIS 2.0 feature blending mode “multiply” as well as data-defined size based on meteorite mass: Background oceans and graticule by NaturalEarthData.
QGIS Training Manual - Locate Press. PDF $23.99 388 pages ISBN 978-0989421706 Published 2013-05-22 Errata Available Now!
Years of experience in a single book─the official Quantum GIS Training Manual written by seasoned trainers. It's the jump-start you need to learn this incredibly popular free desktop mapping and GIS toolset. Comprehensive and structured, your introduction begins with a quick download of example data, making it easy for you to work your way through the concepts and practical exercises, complete with answers and examples.
Ideal for classroom instruction and self-guided learning, included are all the materials needed to run a five day course on Quantum GIS, PostgreSQL and PostGIS. Locate Press is proud to publish this color paperback edition of the QGIS Training Manual, based on the original open source documentation by Linfiniti Consulting. Topics Topics covered in the QGIS Training Manual include: The manual also includes a complete answer sheet for each of the exercises. Resources. Quantum GIS (QGIS) Tutorials. Cómo elaborar el mapa de gran formato y alta resolución con QGIS. QGIS es software de GIS.
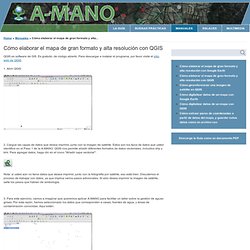
Es gratuito, de código abierto. Delimitar una cuenca hidrológica con GRASS en QGIS. CAD-Tools en QGIS: rotar objetos un ángulo fijo. Una extensión bastante útil corresponde a CAD-Tools (elaborada por Stefan Ziegler).
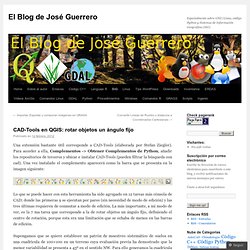
Para acceder a ella, Complementos -> Obtener Complementos de Python, añadir los repositorios de terceros y ubicar e instalar CAD-Tools (pueden filtrar la búsqueda con cad). Una vez instalado el complemento aparecerá como la barra que se presenta en la imagen siguiente: Lo que se puede hacer con esta herramienta ha sido agrupado en 12 tareas más cónsola de CAD; donde las primeras 9 se ejecutan por pares (sin necesidad de modo de edición) y las tres últimas requieren de conmutar a modo de edición. La más importante, a mi modo de ver, es la 7 ma tarea que corresponde a la de rotar objetos un ángulo fijo, definiendo el centro de rotación, porque esta era una limitación que se echaba de menos en las barras de edición. Como la cuadrícula corresponde a un polígono constituido por partes sencillas hay que transformarlo a multipartes para poder rotarlo como una sola entidad.
El modelado geólogico para un geológo sin recursos o entusiasta: GRASS GIS (y Paraview) Ahora que existen aplicaciones especializadas en el modelado geológico en tres dimensiones como Gocad, por ejemplo, ¿qué puede hacer: un geólogo sin recursos que no trabaja en una organización (académica o industrial) que cuenta con licencias para dichos productos o no tiene el dinero para pagarlos;un geólogo aficionado al mundo Open Source y entusiasta; un geólogo que no trabaja sobre Windows?
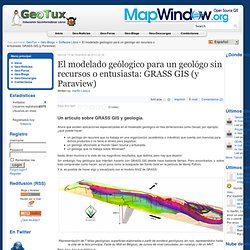
Nada, dirán muchos a la vista de los magníficos resultados, que lástima, pero hay que dejarlo! Sin embargo, hay geólogos que intentan hacerlo con GRASS GIS desde hace bastante tiempo. Pero encontrarlos, y sobre todo comprender como hacen, es un poco como la búsqueda del Santo Grial en la película de Monty Python. Midvatten Plugin for QGIS.