
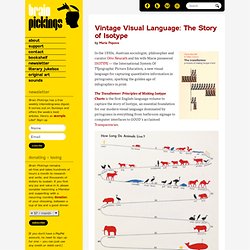
Vintage Visual Language: The Story of Isotype. By Maria Popova The Transformer: Principles of Making Isotype Charts is the first English-language volume to capture the story of Isotype, an essential foundation for our modern visual language dominated by pictograms in everything from bathroom signage to computer interfaces to GOOD’s acclaimed Transparencies.
Britain vs. America in Minimalist Vintage Infographics. By Maria Popova A time-capsule of mid-century cultural contrasts.
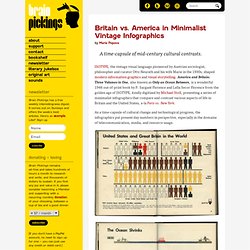
ISOTYPE, the vintage visual language pioneered by Austrian sociologist, philosopher and curator Otto Neurath and his wife Marie in the 1930s, shaped modern information graphics and visual storytelling. America and Britain: Three Volumes in One, also known as Only an Ocean Between, is a wonderful 1946 out-of-print book by P. Sargant Florence and Lella Secor Florence from the golden age of ISOTYPE, kindly digitized by Michael Stoll, presenting a series of minimalist infographics that compare and contrast various aspects of life in Britain and the United States, a-la Paris vs. New York. As a time-capsule of cultural change and technological progress, the infographics put present-day numbers in perspective, especially in the domains of telecommunication, media, and resource usage. For more on the history and legacy of ISOTYPE, see the excellent The Transformer: Principles of Making Isotype Charts.
Share on Tumblr. Startup Happiness. “I’ve written before about CEO coaches.
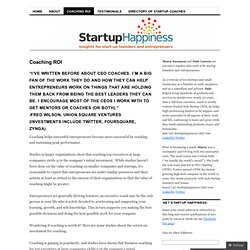
I’m a big fan of the work they do and how they can help entrepreneurs work on things that are holding them back from being the best leaders they can be. I encourage most of the CEOs I work with to get mentors or coaches (or both).” -Fred Wilson, Union Square Ventures (investments include Twitter, FourSquare, Zynga) Coaching helps successful entrepreneurs become more successful by reaching and sustaining peak performance. Studies in larger organizations show that coaching top executives at large companies yields 5-7x the company’s initial investment. Entrepreneurs are generally lifelong learners; an executive coach may be the only person in your life who is solely devoted to accelerating and supporting your learning, growth, and self-knowledge. Strategy. Substance. Style. Women_infographic.jpg (1550×1000) Browse Similar Vectors: 640964. Pie Chart Stock Photos & Vector Art. Online Charts Builder. Hohli.

New World Marketing. 285 million mobile devices in the US.
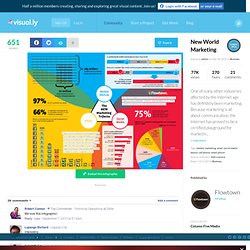
(thats 91% of Americans) 70 million smart phones in the U S. (or 23% of all mobile devices) ls optimizing the mobile marketing experience important? 31.6% yes 28% not sure 24.8% still testing 32.8% no. Anatomy of the Mobile Market. Blue Is Dominating The Web. How Coworking Works. The YouTube Top 1000 Producers. 10 Awesome Free Tools To Make Infographics. Advertisement Who can resist a colourful, thoughtful venn diagram anyway?

In terms of blogging success, infographics are far more likely to be shared than your average blog post. This means more eyeballs on your important information, more people rallying for your cause, more backlinks and more visits to your blog. In short, a quality infographic done well could be what your blog needs right now. 20 Reasons You Should Try Out Google+ - New Images of Education. Facebook-and-grades.jpg (800×4285) Career Geek Confessions of Recruitment Industry [INFOGRAPHIC] The Recruitment Industry is more mystical than the genie from the lamp and more secretive than area 51 in the U.S.
![Career Geek Confessions of Recruitment Industry [INFOGRAPHIC]](http://cdn.pearltrees.com/s/pic/th/confessions-recruitment-42161382)
Somehow, the recruitment industry is full of so many myths that it is becoming difficult to sort out truth from rubbish when it comes to numbers. Career Geek Infographic: Is Your Bad Boss Killing You - Career Geek. We all have bad bosses, or have at least heard of them.
Thankfully, I have never had to deal with a bad boss personally, but dear oh dear, I’ve heard of a few in other teams and from my friends! Career Geek Funny Friday: Sorry Graduates, but this is Funny - Career Geek. We miss Funny Friday’s.
It is this day of the week that we post something funny about careers. In this week’s Funny Friday we bring you a couple of ecards from someecards. It is usually said that Interns are hired for making tea or coffee, we don’t necessarily agree with that. But hey, it’s Friday, so let’s keep our worries aside and enjoy these two images. The image with the professor on it is my personal favourite, as I felt that way every day of my life when I was looking for a job. Career Geek Infographics Archives - Page 5 of 8 - Career Geek. [INFOGRAPHIC] College Is Worth It?
Ah, my favourite subject! Is College worth it? Or in British terms, is a university worth it? Critical Thinking Infographic CT Infographic 2012 – Pearson's Critical Thinking Blog. Is Starting A Business Safer Than Your Job? [Infographic] What's Better - Getting a Job or Starting a Business? With a slow economy, many people have turned to entrepreneurship as a means to pay the bills.
Which begs the question, what’s better today — getting a job or starting a business? We dug deep to find out the numbers and have compared the risk of starting a business to keeping a job. If you’ve ever thought about starting your own company, take a look at our graphic below to help decide if entrepreneurship is right for you. Infographic Resume Booklet. Midlife Crisis. Infographics Elements.
Infographic Elements. Infographics Elements. Infographic Templates and Charts v3. 2 Individual Infographic Templates or Mix and Match Make you very own Infographics from a variety of charts, graphs, icons and custom shapes. All charts are created using Layered Vector Shapes and Editable Text, so that you can customize every aspect of this Photoshop (.psd) template. How to Get Started With Infographics. Media and publishing professionals know that infographics are hugely popular, and are more likely to be shared via social media than a standard blog post or article.
By combining images with data, infographics get much more mileage than text or graphics alone. You can use them for news, presentations, or press releases on your company blog or website to attract publicity and show off your expertise. Companies without a graphic designer on board or on budget couldn't easily take advantage of infographics in the past. However, thanks to online chart and map creation tools, any business can now turn an interesting concept into an engaging infographic. Here's how to get started, along with tools that can step you through the process.