
10 Fun Tools To Easily Make Your Own Infographics. People love to learn by examining visual representations of data.
That’s been proven time and time again by the popularity of both infographics and Pinterest. So what if you could make your own infographics? What would you make it of? It’s actually easier than you think… even if you have zero design skills whatsoever. Below are my two favorite infographic-making web 2.0 tools that I highly recommend. Click the name of each tool to learn more!
Visual.ly One of the more popular ways to discover infographics, Visual.ly actually just launched a design overhaul of their website. How to Make Infographics in the Classroom. A Primer On Infographics In The Classroom. A Primer On Infographics In The Classroom by Pamela Rossow If you are a K-12 teacher or a college professor, you may be searching for new ways to promote digital literacy in your classroom.
Or just plain literacy literacy, for that matter. Infographics can be useful teaching tools as they use so many elements of traditional “teaching”: the writing process, research, and planning, all while combining digital and traditional text forms. 5 Essential Infographics For The Beginner Photographer. I have a journal that I kept when I started to learn photography.
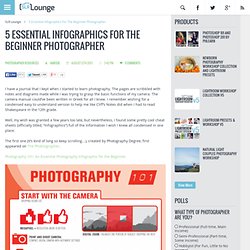
The pages are scribbled with notes and diagrams made while I was trying to grasp the basic functions of my camera. The camera manual could’ve been written in Greek for all I knew. I remember wishing for a condensed easy to understand version to help me like Cliff’s Notes did when I had to read Shakespeare in the 12th grade. Well, my wish was granted a few years too late, but nevertheless, I found some pretty cool cheat sheets (officially titled, “Infographics”) full of the information I wish I knew all condensed in one place. The first one (it’s kind of long so keep scrolling…), created by Photography Degree, first appeared on The Phoblographer. 27 Photography Cheat Sheets and Infographics For Photographers. Home » Inspiration » 27 Photography Cheat Sheets and Infographics For Photographers Advertisement Because of the accessibility and availability of cameras these days, even amateurs and idle aspirants could also capture wonderful and rare moments that catch the attention of the people.
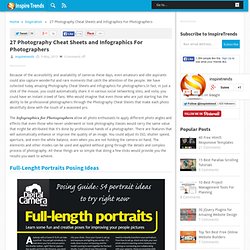
We have collected today amazing Photography Cheat Sheets and infographics for photographers.In fact, in just a click of the mouse, you could automatically share it in various social networking sites, and voila, you could have an instant crowd of fans. Who would imagine that even those who are just starting has the ability to be professional photographers through the Photography Cheat Sheets that make each photo deceitfully done with the touch of a seasoned pro. Full-Lenght Portraits Posing Ideas Digital Camera Action CheatSheet. Infographics Lesson - New Tools.
How it’s Made: Create Your Own Infographic - SkilledUp.com. Meet Mike Wirth, World-Class Infographic Designer This week we had the great pleasure of discussing how to create your own infographic with Mike Wirth, infographic designer, artist, and Director of the New Media Design Department at Queens University in Charlotte, NC.
Mike’s predisposition for design came at young age. Growing up in Long Island in the 1980’s, he was fascinated with graffiti. He also loved National Geographic, which is known for taking readers on a visual journey. Finally, he grew up playing original Nintendo games like the map oriented Legend of Zelda, which developed into an obsession with maps. Mike Wirth, Infographic Designer, Educator, and Artist. Helping students interpret visual representations of information. Update: Feb. 29, 2012 Please note: The original video we used for this post was a video podcast by Gestalten TV in which New York Times Graphics Director Steven Duenes and Graphics Editor Archie Tse describe how their team works with breaking news to create clear, concise visualizations of data for readers.
Since that has now been taken down, we have substituted a classic TED talk by David McCandless that we refer to in the post. David McCandless: The beauty of data visualization. 10 Tips for Designing Infographics. Assuming you’re not working for a media corporation with huge graphics and statistics departments at your disposal, you may want to create some infographics for your own articles.
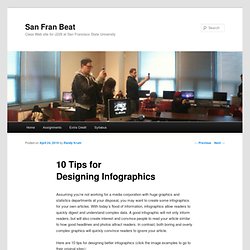
With today’s flood of information, infographics allow readers to quickly digest and understand complex data. A good infographic will not only inform readers, but will also create interest and convince people to read your article similar to how good headlines and photos attract readers. In contrast, both boring and overly complex graphics will quickly convince readers to ignore your article. Here are 10 tips for designing better infographics (click the image examples to go to their original sites): 1) Be Concise: Design your infographic to convey one idea really well.
This example is an infographic poster I created about the caffeine content in drinks. The Caffeine Poster, by Randy Krum. A history teacher uses the oil spill for a student design project. Devon ThomasStudents in Diana Laufenberg’s 11th grade history class discuss the infographics they created in a three-week project on environmental disasters.
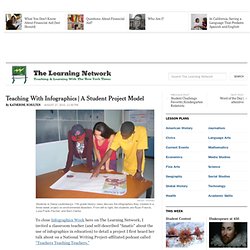
From left to right, the students are Ryan Francis, Luna Frank-Fischer, and Kern Clarke. To close Infographics Week here on The Learning Network, I invited a classroom teacher (and self-described “fanatic” about the use of infographics in education) to detail a project I first heard her talk about on a National Writing Project-affiliated podcast called “Teachers Teaching Teachers.”
Diana Laufenberg has been a public school social studies teacher for the last thirteen years, eight at the middle school level and five in high school. She currently works at the Science Leadership Academy in Philadelphia, which is a partnership high school between the School District of Philadelphia and The Franklin Institute.
So here’s Diana. Learning, Visualized By DIANA LAUFENBERG In the history classroom we are always developing visual literacy. 1. 2. Language Arts, Fine Arts and Entertainment. Have Students Create Infographics Using Google Draw.