
What's Going On in This Graph? The Best Sources For Interactive Infographics. Interactive Infographics are online representations of information or data that usually allow the user to “interact” with it and the data that is visualized.
They’re generally created by newspapers for their websites, and often, though not always, are accessible to English Language Learners. In fact, they can be an exceptionally accessible way for ELL’s to learn complicated information that might ordinarily not be comprehensible. I’ve posted about quite a few interactive infographics over the past three years.
And I’ve posted A Collection Of “The Best…” Lists On Infographics. I thought readers might find it useful to learn which sites I have found to be the best sources of good interactive infographics. The links on this list will take you directly to the Interactive Infographics page of the named newspapers. Here are my picks for The Best Sources For Interactive Infographics: The Boston Globe The Wall Street Journal TIME Magazine The Cleveland Plain Dealer The New York Times The Denver Post. Our World in Data — Visualising the Empirical Evidence on how the World is Changing. Web-based visualisation tools. Infographics. Online Diagram Software and Flowchart Software - Gliffy. Common Core Standards.
Last week, we took a look at CCSS ELA Reading Literature 1.
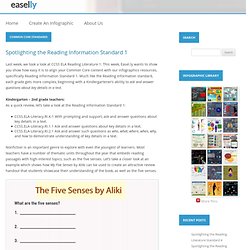
This week, Easel.ly wants to show you show how easy it is to align your Common Core content with our infographics resources, specifically Reading Information Standard 1. Much like the Reading Information standard, each grade gets more complex, beginning with a Kindergartener’s ability to ask and answer questions about key details in a text. Kindergarten – 2nd grade teachers: As a quick review, let’s take a look at the Reading Information Standard 1: CCSS.ELA-Literacy.RI.K.1 With prompting and support, ask and answer questions about key details in a text.CCSS.ELA-Literacy.RI.1.1 Ask and answer questions about key details in a text.CCSS.ELA-Literacy.RI.2.1 Ask and answer such questions as who, what, where, when, why, and how to demonstrate understanding of key details in a text.
Nonfiction is an important genre to explore with even the youngest of learners. Click here to reuse this infographic Click here to reuse this article. 70 Tools And 4 Reasons To Make Your Own Infographics. Infographics are everywhere.
Some love them. Some hate them. But however you feel, it’s fun to learn a little bit in a short period of time. Most are made so you can quickly grasp the key concepts behind them. That’s a key thing to keep in mind if you want to make your own infographics . User showcase. Social Analytics Reports and Infographics. Create and share visual ideas online. Infographic Design - Infographics Showcase. Filed under: | No Comments » Infographic Design by Creative Professional Infographic Designers Not only do we review and showcase infographics, we also provide infographic design.
Looking to increase awareness of your business or drive traffic to your website? Infographics provide a great way to get the word out about your company’s website through viral and social media pushes. A quality infographic design can increase links to your site and help with your site’s rankings in the search engines. We price our infographic design services depending on a number of variables – the amount of information included in the infographic, the complexity of the information, the research involved, etc. All infographics projects start at $1,000 and increase in cost depending on the design’s parameters. 10 Fun Tools To Easily Make Your Own Infographics. People love to learn by examining visual representations of data. That’s been proven time and time again by the popularity of both infographics and Pinterest.
So what if you could make your own infographics ? What would you make it of? It’s actually easier than you think… even if you have zero design skills whatsoever. Below are my two favorite infographic-making web 2.0 tools that I highly recommend. Click the name of each tool to learn more! Visual.ly One of the more popular ways to discover infographics, Visual.ly actually just launched a design overhaul of their website. Dipity.