
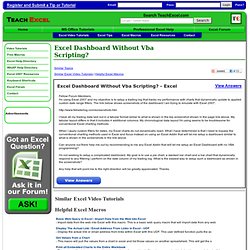
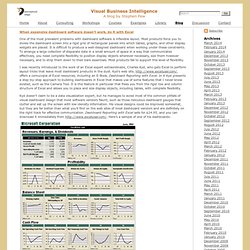
Excel Dashboard Templates - Your Excel Dashboard Template Resource. Balanced Scorecards. How to Create Bullet Graphs to Replace Gauges in Excel. How to structure your dashboard reports - Tip. Excel Templates - Free Excel Templates, Excel Downloads, Excel Charts, VBA Macros and More. Dashboards Examples, Business Intelligence Dashboards, Free KPI Dashboard, Dashboard Samples. Sparklines Excel Add-in - TinyGraphs. Add-ins for Excel® and other tools TinyGraphs Excel Add In TinyGraphs is an open source add-in for Excel that creates sparklines, mini column graphs, and area graphs from a row of data.
It generates beautiful tiny graphics that are as small as a cell and is useful for visualizing large quantities of data, such as stock prices and exchange rates. What does TinyGraphs do ? TinyGraphs creates a tiny chart for every row of data in a rectangular block of cells (user specified range). A sample Excel file that contains TinyGraphs can be found here TinyGraphsSample.xls Screenshots for TinyGraphs The TinyGraphs toolbar in Excel 2003 and Excel 2007 The main dialog for TinyGraphs Using the TinyGraphs plugin is very simple.
Excel - Excel Dashboard Without Vba Scripting? - Fellow Forum... - Free Excel Help. Fellow Forum Members, I'm using Excel 2007 and my objective is to setup a trading log that tracks my performance with charts that dynamically update to applied custom date range filters.
The link below shows screenshots of the dashboard I am trying to emulate with Excel 2007. I have all my trading data laid out in a tabular format simlar to what is shown in the top screenshot shown in the page link above. My tabular layout differs in that it includes 4 additional columns. Dashboard Guy: Excel Template for Dashboards. An easy solution for business intelligence dashboard reporting is sitting right under our noses!
Excel Dashboard Examples - 66 Dashboards to Visualize Excel salaries around world. Ladies & gentleman, put on your helmets.
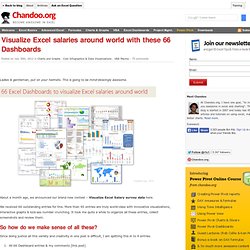
This is going to be mind-blowingly awesome. About a month ago, we announced our brand new contest – Visualize Excel Salary survey data here. We received 66 outstanding entries for this. More than 40 entries are truly world-class with innovative visualizations, interactive graphs & kick-ass number crunching. Excel 2010 Slicer Dashboard. How to Develop Key Performance Indicators (KPIs) The One Page Report an Excel Dashboard and Scorecard.
Excel Dashboards - Templates, Tutorials, Downloads and Examples. Dashboard reports allow managers to get high-level overview of the business.
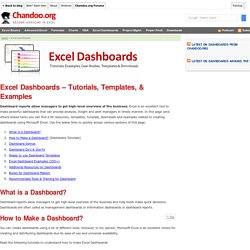
Excel is an excellent tool to make powerful dashboards that can provide analysis, insight and alert managers in timely manner. In this page (and others linked here) you can find a lot resources, templates, tutorials, downloads and examples related to creating dashboards using Microsoft Excel. Use the below links to quickly access various sections of this page. What is a Dashboard? Dashboard reports allow managers to get high-level overview of the business and help them make quick decisions. Excel Dashboard Templates, Advanced Excel Training in Delhi. Tutorial: Create an Excel Dashboard - CommCare Public - Dimagi Confluence. This tutorial will walk you through how to use Microsoft Excel to build a simple dashboard using CommCareHQ data exports.
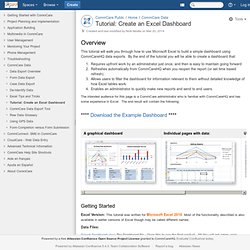
By the end of the tutorial you will be able to create a dashboard that: Requires upfront work by an administrator just once, and then is easy to maintain going forwardRefreshes automatically from CommCareHQ when you reopen the report (or set time based refresh).Allows users to filter the dashboard for information relevant to them without detailed knowledge of how Excel tables work.Enables an administrator to quickly make new reports and send to end users.
The intended audience for this page is a CommCare administrator who is familiar with CommCareHQ and has some experience in Excel. The end result will contain the following: **** Download the Example Dashboard **** Getting Started. Dashboard Examples from The Dashboard Spy.
ExcelDashboarddesign.com - Excel dashboard design tips. Excelmax Soluções, Excel, Software, Simulador, Gráfico, Macro, VBA. Como mencionado na postagem anterior, estou utilizando como banco de dados, alguns dos resultados dos concursos da MegaSena!
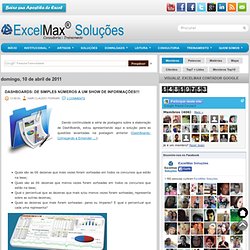
(mais precisamente 1260 concursos conforme vemos na figura ao lado). Através dos diversos recursos disponíveis no Excel e, com um pouco de criatividade, podemos facilmente extrair qualquer informação desejada e disponível em nossa base de dados. Para iniciar, é interessante inserir uma nova planilha para consolidar/extrair os dados num local separado da base de dados. Podemos inserir na coluna 'A' (desta nova planilha) todas as dezenas que compõe uma cartela da megasena (01 a 60). Na coluna 'B', podemos inserir uma fórmula para determinar o número de vezes que cada dezena foi sorteada. Explicando a fórmula: Esta fórmula (Com as funções: Cont.se, Desloc, Aleatório) faz uma contagem das dezenas que estão na base de dados. Com isso, teremos na coluna 'B', as quantidades que cada uma das 60 dezenas foram sorteadas. Dezenas que mais vezes foram sorteadas: Dundas Website Operations Dashboard.
Dundas Website Operations Dashboard The Website Operations Dashboard has been put together to display the various statistics and figures associated with an active website.
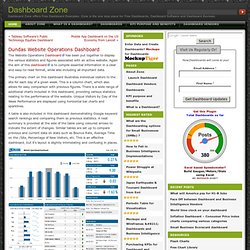
Again the aim of this dashboard is to compile essential information in a clear and easy-to-read format, while also including all important data. The primary chart on this dashboard illustrates individual visitors to the site for each day of a given week. This is a column chart, which also allows for easy comparison with previous figures. There is a wide range of additional charts included in this dashboard, providing various statistics relating to the performance of the website.
A table is also included in this dashboard demonstrating Google keyword search rankings and comparing them so previous statistics. ShareThis Check these related Dashboards Please rate it/strong> Loading ... Both comments and trackbacks are currently closed. When expensive dashboard software doesn’t work, do it with Excel. One of the most prevalent problems with dashboard software is inflexible layout.
Most products force you to divide the dashboard screen into a rigid grid of rectangular panels into which tables, graphs, and other display widgets are placed. Excel Dashboard School - ExcelDashboardSchool.com. Project Timeline Template Detailed Instructions (24 mins) Excel 2010. Create Powerful Excel Dashboards... … and become the Dashboard Master in your organization.
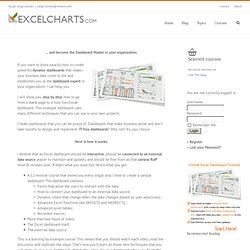
If you want to know exactly how to create powerful dynamic dashboards that makes your business data come to life and establishes you as the dashboard expert in your organization, I can help you. Excel Dashboard Tools Add-in Giveaway. Last week, Jon Wittwer, from Vertex42, provided 4 copies of his awesome Gantt Chart Template Pro, for project tracking. The lucky winners, in my random Excel draw, are: John A Robinson, with comment 23 Neil R, with comment 12 jimmm, with comment 7 Beth, with comment 19 Congratulations! I’ll email you later today, to arrange sending you a copy of the template kit. And thanks Jon, for providing the prizes! Excel Tips & Tricks: The Camera Tool: Excel Camera Picture Link layout dashboard report traffic light semaphore. Everything is captured by the camera: values, formatting, colours, shapes, even the gridlines. What's more, the image can be altered like any other image: scaled, rotated, dimmed, stretched, etc.
Whether you are reading this article looking for a solution to a specific problem or just to enhance your knowledge of Excel, please take an hour or so to play with it. You will find no demo file here, only some guidelines to get you started in your own exploration and one advanced exercise. How to Create an Excel Dashboard - The Excel Charts Blog The Excel Charts Blog. Excel dashboards and executive reports are powerful, fairly easy to design and a great way to improve your Excel and data visualization skills. Because of its flexibility, you can virtually design any dashboard in Excel exactly the way you, or the users, imagined. And, best of all, you may want to implement it yourself or consider it a prototype and ask IT to implement it.
Once you know what will the Excel dashboard be used for and what kind of metrics users expect, there are three major areas that you must address when creating it: how to bring data into your spreadsheets;how to manage the data and link it to the dashboard objects, like charts and tables;how to design the dashboard report. DASHBOARD NO EXCEL. Download free Excel Dashboard Templates, Samples, Addins, Tools for Reporting - www.freeexceldashboards.com.
Designing and Building Great Dashboards - An Example. Over the last couple of weeks I've published a series of articles called 'Designing and Building Great Dashboards. The first post in the series introduced 6 Golden Rules of Dashboard design and in the second post in the series I discussed the use of good data visualisations. In this post I use the rules and tips from the previous posts in this series to create a dashboard. The Brief The CEO of WidgetsRUs.com currently receives a weekly management report that gives an insight into the performance of the business. The report includes details on website usage, customer engagement, financials and some operational data like project status reports. How to Make Enterprise Dashboards in Excel. Excel is the most widely used tool for working with data, and the most familiar analytical environment for business users.
Still, it is more powerful than many of us realise. Excel - Looking For Excel Dashboard Examples - Hi I am looking... - Free Excel Help. Folks, I know this is a not exactly Excel question but I thought I might nonetheless get some sensible technical advice. Essentially I've got some great Excel dashboard stuff working, dynamic ranges, charts plus all the other features that excellent spreadsheets should have and I wanted to extend some of what I'm doing to a Web environment. If you look at something like Wikinvest or Google Finance, those are examples of nice web-browser based interactive charts and I'd like that sort of a thing but on a website for our intranet, website etc, as a sample of what's going on in the sector. I'm pretty hot when it comes to application programming (VBA and C++) so I'm not a complete beginner but I've not really got too much of a clue when it comes to networked/web based stuff, although my SQL is pretty good.
Dashboard Template Layout Wizard. [The OTUS App has been taken down due to licensing issues.