
Excel VBA Copy Paste: The Complete Tutorial And 8 Examples. Excel 2016 crashes with Windows 10. Excel 2016 crashes with Windows 10. Resources. Cash Flow Excel Template in Blue. Monthly and Yearly Budget Spreadsheet Excel Template. Complete Past Questions. Complete Past Questions. Microsoft Excel Functions And Formulas, Book by Bernd Held (Paperback) Microsoft Excel Training Schedule and Microsoft Excel VBA Training Schedule. The Best Financial Modeling Courses for Investment Bankers. Investment banking is focused on evaluating the worth of companies, for the purposes of either capital creation for corporate financing, facilitating mergers and acquisitions (M&A) such as leveraged buyouts (LBOs), corporate restructuring or reorganizations, or investing.

For this reason, financial modeling is an important skill for investment banking professionals. Financial Modeling The process of conducting financial modeling is aimed at creating a mathematical model that reflects the historical, current or projected value or financial performance of a company, a stock, a project, an investment or any financial asset. Financial models are used to calculate the impact of different variables, such as interest rates or corporate growth rates, on the value of an asset. A financial model can range from a simple calculation or formula to a complex series of calculations. There are both live instruction courses and online self-study curricula available. Wall Street Prep Premium Package. The Best Financial Modeling Courses for Investment Bankers.
Free Financial Modeling. Financial Modeling Academy. Financial Modeling Training Courses - Reviews for Best ... Land your dream job, go from novice to financial modeling ninja for only $425 Update: Wall Street Prep offers 15% off for this course for all WSO members!

*Limited time offer! I frequently get e-mails from WSO members and random visitors asking me which financial modeling training program is the best to prepare them for investment banking, private equity, hedge funds, etc...to be honest, many of you don't need any financial modeling courses since you will likely get that training once you start, along with all the fancy the financial model templates, etc. In fact, you can find plenty of free basic modeling resources online... Execute a Macro When Your Mouse is over a Cell. "Rollover B8 OV1" (like Rollover Beethoven...?
Get it?) Update 17 July 2011: This blog entry was featured in Chandoo's latest post. So if you're coming here from his site -- welcome! Original post: Clearly and Simply. Peltier Tech Blog - Peltier Tech Excel Charts and Programming Blog. 30 Best Comprehensive Websites for Excel - Data Recovery Blog. 184 Best Excel Resources on Internet - Data Recovery Blog. In this article, we collect and categorize the best 184 online Excel resources.
Excel is the most popular spreadsheet software in the world. In this article, we have collected the most useful 184 Excel resources on Internet. It is absolutely the biggest list of Excel resources online. And we will update it regularly when new resources are discovered. Just read, comment, share or bookmark it as you like. To make it easy to read and utilize all these resources, we have classified all the resources into 16 categories. SMF Addin Documentation.
Automating Alpha: Getting Started With Stock Market Functions (SMF) Add-In For Excel - Derek A. Barrett. Full index of posts » StockTalks Sold $NLY puts, January at 11 Jul 1, 2014 Sold to open $ADM Sept at 41 Jun 25, 2014 No new positions this week, got tons of dry powder coming back online though after buying to close.

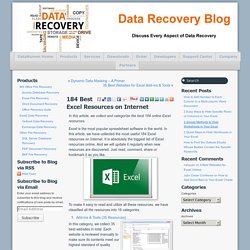
Jun 19, 2014 More » Instablogs are Seeking Alpha's free blogging platform customized for finance, with instant set up and exposure to millions of readers interested in the financial markets. Publish your own instablog in minutes. The quick brown fox jumps over the lazy dog. Ogres-crypt. What are the best practices when modelling in Excel? - Quora. Content. The Definitive Guide to Custom Number Formats in Excel - Excel Tactics. Excel has a lot of built-in number formats, but sometimes you need something specific.
Whether you’re representing a little-used currency, tracking in-stock units, or want to color code profits and losses, you are in need of a custom number format. Tips & Tricks for Writing CUBEVALUE Formulas - Excel Campus. Imagine it’s a hot summer day and you are enjoying a nice cold drink at your favorite spot.

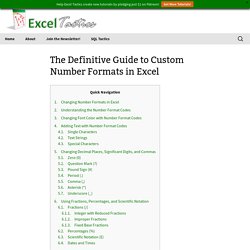
What’s one thing that will make that drink extra refreshing? How to Audit Excel Formulas Like a Pro: Tracing Precedents. When I was in finance, I spent a lot of time auditing Excel workbooks.
When a client would send me their budget, I would go through and make sure all the formulas were written correctly and none were missing. When my Analyst would send me a valuation model, I would do the same thing. When the balance sheet didn’t balance, it took even more time. If you’ve ever used the built-in trace precedent feature within Excel, you know it doesn’t really help that much. The reason it doesn’t help is that zooming to a precedent cell is limited only to the first cell reference in the formula. Luckily, when I was in finance we had a neat tool built by FactSet Research Systems that allowed me to zoom to any precedent. The tool I built is a Visual Basic macro.
The tool relies on code written by Colin Legg that I pulled of his website RAD Excel. After you’ve pasted the below code into your Workbook, I recommend setting a shortcut key to make it easier to call the macro. Directory. Excel auditing tools. Have more faith in the integrity of your spreadsheet models by using the Excel auditing tools available in the Spreadsheet Professional add in.
Save time by using Spreadsheet Professional to audit your spreadsheets. Reviews using this tool will be 100% more efficient and effective. Sales price volume mix variance analysis - who can explain! Horngren variance analysis. Variance Analysis Bibliography. Albery, M. 1953.
Analysis versus interpretation of cost. The Accounting Review (July): 425-430. (JSTOR link). Amicucci, D. J. 1965. Ansari, S. Aranoff, G. 2009. Atkinson, S. Avery, H. Balakrishnan, R. and G. Creating a year-over-year report using an Excel pivot table. An Excel pivot table is a great tool for summarizing data, and a little-known feature lets you roll daily dates... By submitting your email address, you agree to receive emails regarding relevant topic offers from TechTarget and its partners. You can withdraw your consent at any time. Contact TechTarget at 275 Grove Street, Newton, MA. You also agree that your personal information may be transferred and processed in the United States, and that you have read and agree to the Terms of Use and the Privacy Policy. up to months, quarters and/or years.
In Figure 1, two years' worth of detail records have a Date field that is showing daily dates. How to Use Excel Custom Number Formatting. Tagged as: charts, conditional formatting, formatting, visualization To learn more about Excel, go to the organized listing of all my Excel tutorial posts or review the most popular Excel books on Amazon Because it’s buried deep in the cell formatting menu and has very little documentation, Excel’s custom number formatting is probably its most underutilized feature. Understanding and mastering this feature can greatly enhance the Visual Design of your Excel workbooks. 32 Bit Excel Memory Limit Increase! - The Ken Puls (Excelguru) BlogThe Ken Puls (Excelguru) Blog. So this is just huge, especially if you work with Power Pivot models and are stuck in 32 bit Excel… Microsoft has just released a 32 bit Excel Memory Limit increase for users of Excel 2016, effective build 16.0.6868.2060 (which is the current build for the Insiders program.)
Users stuck on 32 bit Excel were limited to only using 2GB of RAM for their Excel/Power Pivot models, no matter how much memory was available on the PC. The answer to this in the past was to install the 64 Bit version of Excel, as that could address up to 8 TB of memory (if you had it, of course.) Create or delete a custom number format - Excel. Excel provides many options for displaying numbers as percentages, currency, dates, and so on. How to Add Total Data Labels to the Excel Stacked Bar Chart. Tagged as: charts, hacks, visualization. How to Make Your Excel Bar Chart Look Better. Tagged as: charts, visualization. Better tools at less than half the cost of similar solutions. Excel BI Tip #18: Using CUBE Functions to Break Out of Pivot Tables. As I mentioned in my original post, Exploring Excel 2013 as Microsoft’s BI Client, I will be posting tips regularly about using Excel 2013 and later.
Much of the content will be a result of my daily interactions with business users and other BI devs. In order to not forget what I learn or discover, I write it down … here. I hope you too will discover something new you can use. New feature updates for Power Pivot in Excel 2016. Ten Useless VBA Coding Errors That Must Be Terminated - Bernard Vukas. Coders have long banned Hungarian notation from their VBA modules. It’s meaningless when the code editor is slick enough to show information about a variable. But now a new crop of equally meaningless, over-used coding errors have begun to litter code modules… and these need to go, too. In my work, I frequently encounter code from other people. Free File Renaming Utility. Client Success Stories A consultant worked with the business to design a range of strategic initiatives that would help the business trade out of difficulty and communicate this effectively to the bank. ... Read more » A consultant worked with the business to design a range of strategic initiatives that would help the business trade out of difficulty and communicate this effectively to the bank.
BlueCaseStudy-Pharmacy.pdf Technip required a solution to secure detailed information on the inventory of parts that each of its suppliers can access to ensure project design specifications could be met for the Wheatstone...... Read more » Technip required a solution to secure detailed information on the inventory of parts that each of its suppliers can access to ensure project design specifications could be met for the Wheatstone project. Ebook Practical Financial Modelling Download.
Excel Solver Help. Over 100 Free Excel Spreadsheets. Using Cell Styles for Financial Modelling. When developing a financial model, standards will often communicate the importance of developing a style guide to enhance the presentation and readability of a financial model for those who are external to its initial development. The use of a distinct style should help to enhance the presentation, simplify ongoing model audit, and add a level of consistency and professionalism to the overall build of the model.
Standardising styles will always be a difficult, as each model developer will have his/her own preferences with regards to the various style components. However, to engage in best practice, the most important thing is to be consistent within your model stakeholders, that is ensuring consistency in approach between those who are commonly affected, or can be affected by your financial modelling. Financial Modelling in the Power Sector - Course Home. Home. Excel Waterfall Charts (Bridge Charts) Waterfall charts are commonly used in business to show how a value changes from one state to another through a series of intermediate changes. For example, you can project next year’s profit or cash flow starting with this year’s value, and showing the up and down effects of changing costs, revenues, and other inputs. Waterfall charts are often called bridge charts, because a waterfall chart shows a bridge connecting its endpoints. Nick's step by step guide to learn VBA. Excel How To Videos.
How to Create a Panel Chart in Excel. ExcelVbaIsFun.