
Cell Phone Reviews - Phone Arena. The Whole Street. Backtest and Calculate Profit and Loss in Excel. Once you've developed your trading model logic in Excel, the next step is to backtest it over a wide range of securities, time frames, and historical data sets.
How to Backtest a Trading Model in Excel There are several ways to backtest a trading model. You can do it visually by recording the buy, sell, and out signals given by your model in an Excel spreadsheet, including the date, time, and theoretical trade prices. This is very slow and cumbersome. Further, backtesting manually only gives you a rudimentary idea of your model's performance. Alternatively, you can code your model with dedicated software like this back testing program.
The best method for backtesting your Excel trading model is to use Excel itself to implement a backtesting system. Building a Backtesting Model in Excel Building the backtesting model begins with designing the data handling layout. Once the data handling is designed, next comes the actual trading logic. Risk Model Spreadsheets in Excel. When was the last time you had to build a risk model in Excel?
Do you remember wishing for a step by step guide? A model template? A translation of the differential equation from continuous to discrete spreadsheet friendly implementation? A risk spreadsheet that you could actually follow? From Option pricing to Value at risk; from Asset Liability Management to Treasury profitability analysis Excel spreadsheets simplify our lives and make it possible for us to generate and test answers and analysis. We do this by providing high level views of spreadsheet models; discrete spreadsheet friendly implementations and quite frequently a step by step guide to building a model. The risk model spreadsheet guide is for do it yourself (DIY) types. The collection represents everything we have written on building risk, portfolio and banking spreadsheet models over the last three years.
Enjoy. Figure 1 Option Pricing using Monte Carlo Simulation – Pricing a lookback option. The Automated Trader: Walk forward analysis. I have completed a walk forward analysis on my system, and tested it on the out-of-sample data from 01-01-2004 until 30-06-2007 (3.5 years).
This was previously untouched data that the system has never seen. It can be considered as "tomorrow's data". The results were promising and have validated the robustness of the system. Robert Pardo, in his excellent book, included in my recommended texts, mentions that one method of assessing out-of-sample testing results is by a ratio known as the walk forward efficiency (WFE).
Cutting Edge Walk Forward Optimizer with 30+ new superior performance metrics. The Power Walk Forward Optimizer (PWFO) is a cutting-edge automatic walk forward testing program that eliminates the ad hoc curve fitting produced by optimization of strategy input values on spurious price movements.
This package contains a walk forward optimization add-on program that can be added to any TS or MC strategy using TS or MC multiple strategy option. The PWFO prints out the in-sample performance and the out-of-sample performance results, on one line, for each input variable combination that is run by the TradeStation(TS) optimization module to a user selected spreadsheet comma delimited file. The PWFO can generate up to 500 different in-sample and out-of-sample date optimization files in one optimization run saving the user from having to generate optimization runs one at a time. Abnormal Returns. Quant Blog Aggregator. Why I Do What I Do. There are a lot of investing-related blogs doing their thing out there in the blogosphere and I’m very interested in understanding why.
What motivates all of these nuts to spend their bit of time on this earth educating you and me on the ways of these unruly markets? Note: Abnormal Returns has done some very good posts on this subject like this one. I of course am one of these nuts, so I want to take a step back and share the three reasons why I do what I do. As a side benefit, this will also be the post I’ll refer to when I receive the obligatory email asking me “if you’re so good, why are you wasting time with this research and not sitting on a beach somewhere?”
Reason #1: Keeping the Idea Factory Full I try to write 3-4 quality posts a week about something (hopefully) new and interesting that will make people say hmmm. Reason #2: I Never Share Anything I Would Trade Myself Reason #3: The Profit Motive Here’s my formula. Pick Timing Strategy. Trading Strategies: Real Verifiable Results. CodeForTraders. Walk-Forward Analysis (WFA) Through basic backtesting one can arrive at evidence-based statements about what trading rules would have been profitable had they been operating during the past as it occurred.
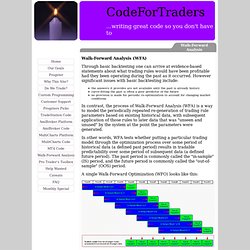
However significant issues with basic backtesting include: the answers it provides are not available until the past is already history curve-fitting the past is often a poor predictor of the future no provision is made for periodic re-optimization to account for changing market conditions In contrast, the process of Walk-Forward Analysis (WFA) is a way to model the periodically repeated re-generation of trading rule parameters based on existing historical data, with subsequent application of those rules to later data that was "unseen and unused" by the system at the point the parameters were generated.
CodeForTraders. Abnormal Returns.