
情報検索ことはじめ~教科書編~ - 睡眠不足?! Introduction to Information Retrieval. Iir / ppt. Soar. Soar News and Announcements We are pleased to announce the 34th Soar Workshop!
It will be held the week of June 16th, 2014 at the University of Michigan in Ann Arbor. There is no charge to attend the workshop, although registration is required. For more detailed information, please visit the the workshop home page linked above, which will have the most up-to-date information.New Soar publication: Kirk, J. and Laird J. E. 2013: Learning Task Formulations through Situated Interactive Instruction, ProceProceedings of the 2nd Conference on Advances in Cognitive Systems.
Linked Data: Evolving the Web into a Global Data Space. 『集合知プログラミング』 解体新書. Memetic Labs. AllegroGraph vs. MongoDB comparison. Data Visualization: Modern Approaches - Smashing Magazine. About The Author Vitaly Friedman loves beautiful content and doesn’t like to give in easily. When he is not writing or speaking at a conference, he’s most probably running … More about Vitaly Friedman … Data presentation can be beautiful, elegant and descriptive.
There is a variety of conventional ways to visualize data - tables, histograms, pie charts and bar graphs are being used every day, in every project and on every possible occasion. However, to convey a message to your readers effectively, sometimes you need more than just a simple pie chart of your results. Data presentation can be beautiful, elegant and descriptive. So what can we expect? Let’s take a look at the most interesting modern approaches to data visualization as well as related articles, resources and tools. 1. Trendmap 2007 Informationarchitects.jp presents the 200 most successful websites on the web, ordered by category, proximity, success, popularity and perspective in a mindmap. 50 Great Examples of Data Visualization. Wrapping your brain around data online can be challenging, especially when dealing with huge volumes of information.
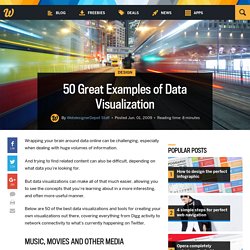
And trying to find related content can also be difficult, depending on what data you’re looking for. But data visualizations can make all of that much easier, allowing you to see the concepts that you’re learning about in a more interesting, and often more useful manner. Below are 50 of the best data visualizations and tools for creating your own visualizations out there, covering everything from Digg activity to network connectivity to what’s currently happening on Twitter. Music, Movies and Other Media. Survey of Pythonic tools for RDF and Linked Data programming. In this post I’m reporting on a recent survey I made in the context of a Linked Data project I’m working on, SAILS.
The Resource Description Framework (RDF) is a data model and language which is quickly gaining momentum in the open-data and data-integration worlds. In SAILS we’re developing a prototype for rdf-data manipulation and querying, but since the final application (of which the rdf-components is part of) will be written in Python and Django, in what follows I tried to gather information about all the existing libraries and frameworks for doing rdf-programming using python. 1. Python libraries for working with Rdf RdfLib. (still) nothing clever — A quick and dirty guide to YOUR first time with RDF. AllegroGraph vs. MongoDB comparison. Linked_data_projects. DATA visualisation. Vs the WWW - TunesWiki. Read Write Web Community Group. Earlier this month RWW.IO was launched, to much positive feedback.
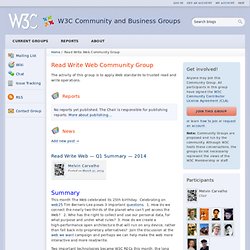
In this post I will show how RWW.IO can be used to extend your FOAF file to become a distributed microblog. *Disclaimer* this tutorial is for advanced users that may be prepared to live on the bleeding edge, and maybe do some debugging. Step 1 — Create a FOAF profile If you’ve followed previous posts, you probably have a FOAF profile by now. The FOAF is used to give a nick, avatar, name and URL for the micro blog creator. Ontology learning.
Typically, the process starts by extracting terms and concepts or noun phrases from plain text using linguistic processors such as part-of-speech tagging and phrase chunking.
Then statistical[1] or symbolic[2] [3] techniques are used to extract relation signatures. Procedure[edit] Ontology-based Information Extraction - TechWiki. From TechWiki Ontology-based information extraction , or OBIE for short, is the use of ontologies and their specifications to "drive" or inform the information extraction process.
The terms and concepts in the source ontology(ies) form the basis for term matching when tagging text documents. OBIE is a form of knowledge extraction where the knowledge basis is the ontology. Though ontologies have been used for some time as the basis for driving information extraction systems, the specific use of the term OBIE appears to have first occurred in relation to the SEKT project. [1] . Knowledge engineering. Knowledge engineering (KE) was defined in 1983 by Edward Feigenbaum, and Pamela McCorduck as follows: KE is an engineering discipline that involves integrating knowledge into computer systems in order to solve complex problems normally requiring a high level of human expertise.[1] It is used in many computer science domains such as artificial intelligence,[2][3] including databases, data mining, bioinformatics, expert systems, decision support systems and geographic information systems.
Lncs-svm-revision.dvi - lncs-svm-revision.pdf. KWTR: Machine learning for NLP. Main Contributors:
