
A Collection Of “The Best…” Lists On Infographics. The New York Times Learning Network just published a great post, Data Visualized: More on Teaching With Infographics.

Their post will certainly be on this year’s list “The Best…” list of infographics. In addition, it prompted me to think it might be useful if I put all my infographic-related “The Best…” lists together (I also post weekly collections). Pretty pictures: Can images stop data overload? 16 April 2012Last updated at 19:01 ET By Fiona Graham Technology of business reporter, BBC News Brain scan: Research suggests that one way to avoid being overloaded by data is by presenting it visually rather than text or numbers Sitting at your desk in the middle of the day, yet another email notification pops up in the corner of the screen, covering the figures you're trying to digest in the complicated spreadsheet in front of you.
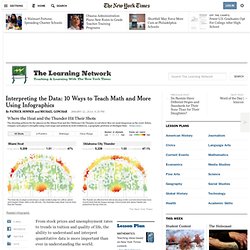
Your laptop is open on the desk next to you with another set of figures you need - meanwhile you're frantically tabbing through different documents on the main screen. Interpreting the Data: 10 Ways to Teach Math and More Using Infographics. From stock prices and unemployment rates to trends in tuition and quality of life, the ability to understand and interpret quantitative data is more important than ever in understanding the world.
Over the years we’ve written many posts about teaching with Times infographics, including a 2010 series about using them across the curriculum, and a 2011 lesson called “Data Visualized: More on Teaching With Infographics.” If you like, you can scroll through our entire collection of posts that highlight Times interactives and graphics here.
Below, we offer a math-focused list of 10 ways students can learn from and tell stories with the numbers in some recent charts, tables and interactives found in The Times. 1. Tell a Story Pick a graph from The Times that plots some quantity over time and use it to tell a story. For example, the first graph in “The War on Poverty Turns 50″ shows several different poverty rates in the United States over the past 50 years. 2. 3. 4. 5. 6. Hans Rosling: The best stats you've ever seen. Mathematical cake slice. Data. Designers Make Data Much Easier to Digest. David McCandless: The beauty of data visualization.
10 Tips for Designing Infographics. Assuming you’re not working for a media corporation with huge graphics and statistics departments at your disposal, you may want to create some infographics for your own articles.

With today’s flood of information, infographics allow readers to quickly digest and understand complex data. A good infographic will not only inform readers, but will also create interest and convince people to read your article similar to how good headlines and photos attract readers. In contrast, both boring and overly complex graphics will quickly convince readers to ignore your article. Here are 10 tips for designing better infographics (click the image examples to go to their original sites): 1) Be Concise: Design your infographic to convey one idea really well. This example is an infographic poster I created about the caffeine content in drinks. The Caffeine Poster, by Randy Krum 2) Be Visual: Design your infographic with your final for viewing size in mind. Google PageRank Explained, by Elliance.
8 Factors of a Good Infographic. Infographics have become incredibly popular over the past 12 months, which is both good and bad.
The popularity of this new design medium is great because it provides webmasters and business owners with a new and creative method of brand building and connecting with users. The popularity is a bit negative in the sense that there are many people out there creating infographics simply for links, which is causing the space to fill up with spammy and poorly designed infographics. With so many infographics living around the world wide web, how do we differentiate the good from the bad? And as a business owner, how do you find the right designer for your infographic? Luckily, there are some distinguishing factors of a good infographic that will help both designers and their clients hit the high bar that has been set by some top infographic design agencies.
When looking at an infographic, check to see if it has the following factors: 1. 2. 3. An infographic should tell a story. 4. 5. 6. 7. 8. Data Visualized: More on Teaching With Infographics. A BBC documentary featured Dr.
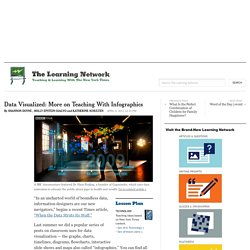
Hans Rosling, a founder of Gapminder, which uses data animation to educate the public about gaps in health and wealth. Go to related article » “In an uncharted world of boundless data, information designers are our new navigators,” begins a recent Times article, “When the Data Struts Its Stuff.” Last summer we did a popular series of posts on classroom uses for data visualization — the graphs, charts, timelines, diagrams, flowcharts, interactive slide shows and maps also called “infographics.”
You can find all five posts linked from the first one, “Teaching With Infographics | Places to Start.” Today we add to our collection with some new resources inspired by this latest Times article. Key Questions What are the purposes of visual displays like the charts, maps, graphs, timelines, tables and other features known as “infographics”?