
Data Science Data Architecture. Data scientists are kind of a rare breed, who juggles between data science, business and IT.

But, they do understand less IT than an IT person and understands less business than a business person. Which demands a specific workflow and data architecture. By Dr. Olav Laudy (Chief Data Scientist, IBM Analytics, Asia Pacific). Introduction This article describes the data architecture that allows data scientists to do what they do best: “drive the widespread use of data in decision-making”. IT versus Data Science terminology IT landscapes can go as extensive as DTAP: Development, Testing, Acceptance, Production environment, but more often IT architectures follow a subset of those.
A model development environment needs to have production-grade availability in multiple aspects: A model development environment needs to have development status in the following aspects: A data scientists needs to work against a database with the ability to create, fill and drop tables. Machine Learning. Comp_Pop_Tests_Nonparametriques. Choisir le test statistique approprié. Citation : Introduction aux statistiques - © 1996, Ramousse R., Le Berre M.
& Le Guelte L. 3. Choisir le test statistique approprié Le plus souvent nous disposons de différents tests pour une recherche (validation d'hypothèse) donnée, il est alors nécessaire d'employer une méthode rationnelle pour choisir le test le plus approprié. Nous avons vu que l'un des critères de choix est la puissance du test utilisé. Mais d'autres critères sont importants pour déterminer l'adéquation d'un test lors de l'analyse de données particulières.
La façon dont l'échantillon a été réalisé, la nature de la population de laquelle a été tiré l'échantillon et la nature des mesures réalisées.3.1. Lorsque nous définissons la nature de la population et le mode d'échantillonnage, nous établissons un modèle statistique (c'est à dire une formulation mathématique des hypothèses faites sur les observations). 3.2. Il est donc très important de considérer la nature des données (observations) que l'on va tester.
Visualization: Area Chart - Google Charts. Overview An area chart that is rendered within the browser using SVG or VML.
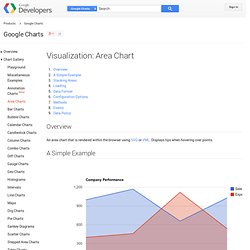
Displays tips when hovering over points. A Simple Example var chart = new google.visualization.AreaChart(document.getElementById('chart_div')); chart.draw(data, options); } </script> </head> <body> <div id="chart_div" style="width: 900px; height: 500px;"></div> </body></html> Stacking Areas By default, the area chart draws the series on top of one another. Note that the order of the legend entries is different. Suppose one of your series has no data for some of your x-values. If those discontinuities don't appeal, you can substitute zeros for the nulls: Loading The google.load package name is "corechart". Highcharts - Interactive JavaScript charts for your webpage.
Grafico javascript charting library documentation. Grafico is a graphing library based on Raphaël and Prototype.js.
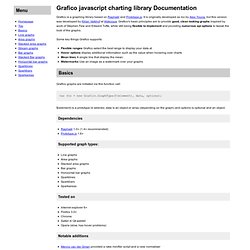
It is originally developed as Ico by Alex Young, but this version was developed by Kilian Valkhof at Wakoopa. Grafico's basic principles are to provide good, clean looking graphs inspired by work of Stephen Few and Edward Tufte, while still being flexible to implement and providing numerous api options to tweak the look of the graphs. Some key things Grafico supports: Flexible ranges Grafico select the best range to display your data at Hover options display additional information such as the value when hovering over charts Mean lines A single line that display the mean. Watermarks Use an image as a watermark over your graphs Basics Grafico graphs are initiated via this function call: var foo = new Grafico.GraphType($(element), data, options); $(element) is a prototype id selector, data is an object or array (depending on the graph) and options is optional and an object.
Dependencies Supported graph types: Tested on colors draw_axis. JavaScript Area Charts. Gallery · mbostock/d3 Wiki. Wiki ▸ Gallery Welcome to the D3 gallery!

More examples are available for forking on Observable; see D3’s profile and the visualization collection. Please share your work on Observable, or tweet us a link! Visual Index Basic Charts Techniques, Interaction & Animation Maps Statistics Examples Collections The New York Times visualizations Jerome Cukier Jason Davies Jim Vallandingham Institute for Health Metrics and Evaluation Peter Cook Charts and Chart Components Bar Chart Histogram.