
On the randomness of plus/minus - Japers' Rink. Kesler's "Disappointing" Postseason. I haven't been impressed at all with Ryan Kesler this postseason, and not many people are.
Abs aside, playoff Kesler has appeared totally different, and less effective, than regular season Kesler. Diving, whining, slashing, all the bad stuff that has made people who don't watch this team as closely as we do say: "say, that isn't right". Did I consider the possibility that Game 4 may be the last we see of Kesler in a Canucks uniform? Shots, Fenwick and Corsi. From time-to-time, I'll find myself surfing aimlessly throughout the hockey blogging world in search of articles, discussions, and other interesting stuff.
In doing so, I'll occassionally find that others have referenced or linked to my blog. Typically, the link or reference will relate to the even strength data that I've been publishing periodically throughout the season. There seems to be a decided preference for EV tied and EV close data over the raw numbers. That makes sense - the raw data is subject to score effects, which makes the information less valuable with respect to distinguishing good teams from bad ones.
Interestingly, however, there doesn't appear to be a general agreement as to which of shot, fenwick and corsi percentage serves as the best metric to use once score effects have been controlled for. Gabe's discovery may account for the slight preference towards fenwick discussed above. r xy adjusted = r xy observed/ SQRT( reliability x * reliability y)
The 'Shot Quality' Fantasy. You can't swing a cat on the internet without hitting a goaltender apologist.
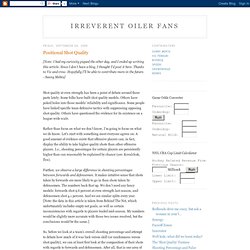
Every time that a goaltender has a bad year in terms of save percentage, frightening and unrecognizable excuses come squirting out of every orifice of the hockey internet. A defensible rationalization would be "He was just unlucky, the shooters made their shots this year. Relax. " But you never hear that one. Forest v. Trees. I thought I would take a quick look at the effect of defensemen on save percentage, relative to their teammates.
This is just for 5v5 in the NHL during the past two seasons. To do this I used Desjardins' terrific behindthenet statistics site. I arbitrarily set the cutoff at 30 games played, and grabbed the 08/09 and 09/10 data. From there I took the on-ice save percentage and subtracted the off-ice save percentage. The off-ice save percentage applies only to the games in which the player was on the roster. By way of example, in 08/09 Chris Pronger had a 5v5 on-ice save percentage of .915. This season Pronger was +.008. The same exercise was repeated for all players. Real Effects: If there is a real ability of defensemen to affect shot quality, it should repeat from season to season in the general population. Shot quality revisited: A look at the correlation between scoring chances and shot totals. Eric T.
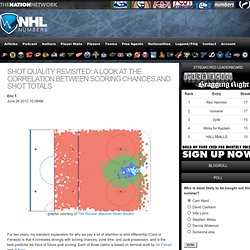
June 26 2012 10:08AM - graphic courtesy of The Russian Machine Never Breaks For two years, my standard explanation for why we pay a lot of attention to shot differential (Corsi or Fenwick) is that it correlates strongly with scoring chances, zone time, and puck possession, and is the best predictor we have of future goal scoring. Each of those claims is based on seminal work by Vic Ferrari and JLikens. The claim about scoring chances was based largely on this plot from Vic, showing a correlation between scoring chances and Fenwick of 0.92: A comprehensive data review If scoring chances correlate that closely to shot differential, then that would suggest that shot quality differences are negligible, that tracking the scoring chances isn't really adding much information. Positional Shot Quality. [Note: I had my curiosity piqued the other day, and I ended up writing this article.
Since I don't have a blog, I thought I'd post it here. Thanks to Vic and crew. Hopefully I'll be able to contribute more in the future. - Sunny Mehta] Shot quality at even strength has been a point of debate around these parts lately. Some folks have built shot quality models. Rather than focus on what we don’t know, I’m going to focus on what we do know.
Further, we observe a large difference in shooting percentages between forwards and defensemen. So, before we look at a team’s overall shooting percentage and attempt to debate how much of it was luck versus skill (or randomness versus shot quality), we can at least first look at the composition of their shots with regards to forwards and defensemen. The following chart shows the results of my inquiry: Zone Time. From 1999/2000 through the 2001/2002 seasons, the NHL recorded zone times and published them on their game sheets.
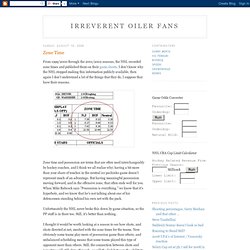
I don't know why the NHL stopped making this information publicly available, then again I don't understand a lot of the things that they do, I suppose they have their reasons. Zone time and possession are terms that are often used interchangeably by hockey coaches, and I think we all realize why; having a bit more than your share of touches in the neutral ice pachinko game doesn't represent much of an advantage. But having meaningful possession moving forward, and in the offensive zone, that often ends well for you.
When Mike Babcock says "Possession is everything. " we know that it's hyperbole, and we know that he's not talking about one of his defencemen standing behind his own net with the puck. Unfortunately the NHL never broke this down by game situation, so the PP stuff is in there too.