
Modern Records of Atmospheric Carbon Dioxide (CO2) and a 2000-year Ice-core Record from Law Dome, Antarctica. Introduction This page provides an introduction and links to records of atmospheric carbon dioxide (CO2) concentrations over the last 2000 years, emphasizing large data bases each representing many currently active stations.
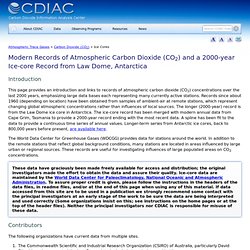
Records since about 1960 (depending on location) have been obtained from samples of ambient-air at remote stations, which represent changing global atmospheric concentrations rather than influences of local sources. The longer (2000-year) record is from the Law Dome ice core in Antarctica. The ice-core record has been merged with modern annual data from Cape Grim, Tasmania to provide a 2000-year record ending with the most recent data. A spline has been fit to the data to provide a continuous time series of annual values.
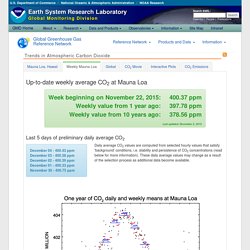
The World Data Center for Greenhouse Gases (WDCGG) provides data for stations around the world. Carbon Dioxide (CO2) ESRL Global Monitoring Division - Global Greenhouse Gas Reference Network. Up-to-date weekly average CO2 at Mauna Loa Week beginning on November 22, 2015: 400.37 ppm Weekly value from 1 year ago: 397.78 ppm Weekly value from 10 years ago: 378.56 ppm Last updated: December 5, 2015.
CHAPTER 7. THE GREENHOUSE EFFECT. We examine in this chapter the role played by atmospheric gases in controlling the temperature of the Earth.
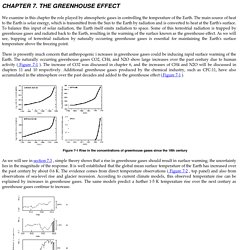
The main source of heat to the Earth is solar energy, which is transmitted from the Sun to the Earth by radiation and is converted to heat at the Earth's surface. To balance this input of solar radiation, the Earth itself emits radiation to space. Permafrost Methane. By Alan Buis, NASA Jet Propulsion Laboratory The CARVE campaign flights are conducted aboard a specially instrumented NASA C-23 Sherpa aircraft from NASA's Wallops Flight Facility, Wallops Island, Va.
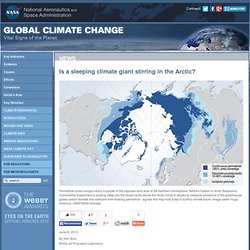
Most of the time, the CARVE scientists fly the plane "down in the mud," at about 500 feet (152 meters) above the ground. The low altitude above the Arctic surface allows the scientists to measure interesting exchanges of carbon taking place between Earth's surface and atmosphere. Image credit: NASA/JPL-Caltech Flying low and slow above the wild, pristine terrain of Alaska's North Slope in a specially instrumented NASA plane, research scientist Charles Miller of NASA's Jet Propulsion Laboratory, Pasadena, Calif., surveys the endless whiteness of tundra and frozen permafrost below.
"The Arctic is critical to understanding global climate," he said. What lies beneath. How do we know that recent CO2 increases are due to human activities? An updated version of this post is now available.
The fact that CO2 increases in the past 150 years are due virtually entirely to human activities is so well established that one rarely sees it questioned. Yet is is quite reasonable to ask how we know this. There are actually multiple, largely independent lines of reasoning, discussed in some detail in the IPCC TAR report, Chapter 3.
One of the best illustrations of this point, however, is not given in IPCC. Indeed, it seems not all that well appreciated in the scientific community, and is worth making more widely known. How do we know that recent CO2 increases are due to human activities? Note:This is an update to an earlier post, which many found to be too technical.
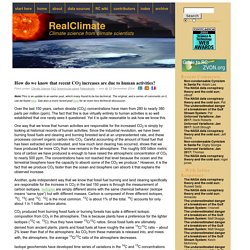
The original, and a series of comments on it, can be found here. See also a more recent post here for an even less technical discussion. Over the last 150 years, carbon dioxide (CO2) concentrations have risen from 280 to nearly 380 parts per million (ppm). The fact that this is due virtually entirely to human activities is so well established that one rarely sees it questioned. Yet it is quite reasonable to ask how we know this. Ian Plimer. Ian Rutherford Plimer (born 12 February 1946) is an Australian geologist, professor emeritus of earth sciences at the University of Melbourne,[1] professor of mining geology at the University of Adelaide,[2] and the director of multiple mineral exploration and mining companies.[3] He has published many scientific papers, six books and is one of the co-editors of Encyclopedia of Geology.[4][5] Early life and education[edit] Ian Plimer grew up in Sydney and attended Normanhurst Boys' High School.[6] He earned a B.Sc.

Roy Spencer (scientist) He is known for his satellite-based temperature monitoring work, for which he was awarded the American Meteorological Society's Special Award.[3] Spencer received a B.S. in Atmospheric Sciences from the University of Michigan in 1978 and his M.S. and Ph.D. in Meteorology from the University of Wisconsin–Madison in 1980 and 1982.[2] His doctoral thesis was titled, A case study of African wave structure and energetics during Atlantic transit.[4] After receiving his Ph.D. in 1982, Spencer worked for two years as a research scientist in the Space Science and Engineering Center at the University of Wisconsin–Madison.[2] He then joined NASA's Marshall Space Flight Center as a visiting scientist in 1984,[3] where he later became a Senior Scientist for Climate Studies.[2] After leaving NASA in 2001, Spencer has been a Principal Research Scientist at the University of Alabama in Huntsville (UHA).[2] As well as his position at UHA, Spencer is currently the U.S.
On July 18, 2013 before U.S. Carbon Cycle and Atmospheric Carbon IPCC 3.