
Slu-openGIS/biscale: Bivariate Mapping with ggplot2. EmilHvitfeldt/palette2vec: Technique to Embed Color Palettes to Multidimensional Space. Markushlang/elgreco: El Greco color palette for R. Evolve new colour palettes in R with evoPalette - Daniel Oehm. What’s that saying?
Choice is the enemy of happiness, or something like that. There are so many colour palettes out there, that saying tends to resonate when either choosing one, or creating a new one. So, I started to think about a way I could make this more organic, and came up with the idea for evoPalette. ColorBlindness Guide. How to standardize group colors in data visualizations in R – paulvanderlaken.com. One best practice in visualization is to make your color scheme consistent across figures.
For instance, if you’re making multiple plots of the dataset — say a group of 5 companies — you want to have each company have the same, consistent coloring across all these plots. R has some great data visualization capabilities. Particularly the ggplot2 package makes it so easy to spin up a good-looking visualization quickly. The default in R is to look at the number of groups in your data, and pick “evenly spaced” colors across a hue color wheel. Building Color Palette Proofs of Concept with purrr and ggplot2 · Karl Hailperin. One of the best ways to make your data visualization work stand out is by breaking away from your tool’s default color scheme.
This also has the benefit of making your work more accessible to users with color blindness, as many default palettes aren’t designed for users with visual issues. Your boss may be open to the idea, but (understandably) doesn’t want you to just start tinkering with your products. The solution is to make mockups of possible new palettes first. Then, you and your manager can decide if any of them are better than your current colors. Fortunately, the tidyverse makes it fast to generate proofs of concept for several color options.
EmilHvitfeldt/paletteer: □□□ Collection of most color palettes in a single R package. Best Color Palette Generators — HTML Color Codes. Coolors Visit Site Hyped as the "new super-fast color palettes generator", Coolors delivers on all fronts; and we think you'll agree.
Colormind - the AI powered color palette generator. Sphere: Color Theory Visualizer. Scientific Journal and Sci-Fi Themed<br>Color Palettes for ggplot2. My eyes were finally opened and I understood nature.I learned at the same time to love it.— Claude Monet ggsci offers a collection of high-quality color palettes inspired by colors used in scientific journals, data visualization libraries, science fiction movies, and TV shows.
ColorBrewer: Color Advice for Maps. Katiejolly/nationalparkcolors: R package for color themes inspired by national parks. Overview fishualize palettes. EmilHvitfeldt/prismatic: color manipulation R package Simple and Tidy. Polychrome: Creating and Assessing Qualitative Palettes with Many Colors. Leonawicz/imgpalr: R package for generating color palettes from arbitrary images. Introducing {tvthemes}: ggplot2 palettes and themes from your favorite TV shows! This blog post will provide an intro to {tvthemes} as well as some lessons learned (codecov, Github badges, creating a hexsticker, usethis::use_*(), unit testing for ggplot2, etc.) and the future direction of the package.
What kick-started this idea was my blog post looking at simple TV stats on my current favorite TV show, Brooklyn Nine-Nine. Extracting colours from your images with Image Quantization. Colorspace: New Tools for Colors and Palettes. A major update (version 1.4.0) of the R package colorspace has been released to CRAN, enhancing many of the package's capabilities, e.g., more refined palettes, named palettes, ggplot2 color scales, visualizations for assessing palettes, shiny and Tcl/Tk apps, color vision deficiency emulation, and much more.
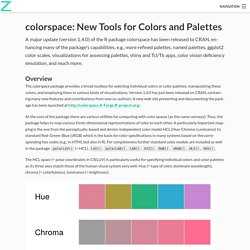
Overview The colorspace package provides a broad toolbox for selecting individual colors or color palettes, manipulating these colors, and employing them in various kinds of visualizations. Version 1.4.0 has just been released on CRAN, containing many new features and contributions from new co-authors. A new web site presenting and documenting the package has been launched at At the core of the package there are various utilities for computing with color spaces (as the name conveys).
The colorspace package provides three types of palettes based on the HCL model: Hrbrmstr/hrbrthemes: Opinionated, typographic-centric ggplot2 themes and theme components. [ggplot2] Welcome viridis ! - (en) The R Task Force. Let’s welcome the viridis palette into the new version of {ggplot2}!
![[ggplot2] Welcome viridis ! - (en) The R Task Force](http://cdn.pearltrees.com/s/pic/th/ggplot2-welcome-viridis-force-179758235)
Viri-what ? Viridis is one of the favorite color palettes of one of the member of the team (guesswho). The viridis palette was first developed for the python package matplotlib, and has been implemented in R since. The strengths of this palette are that: plots are beautiful (which is good enough a reason to use it)colors are perfectly perceptually-uniform, even when printed in black and white (yes, people still print stuffs in 2018…)colors are perceived by the most common forms of color blindness (an important feature) Colorgorical. To generate a palette with n colors, just enter the number of colors you want and click Generate.
Bigger palettes will take longer than smaller palettes to make. Results will automatically appear when ready. For greater detail, please consult our paper or the source code. Scientific Journal and Sci-Fi Themed Color Palettes for ggplot2. Cttobin/ggthemr: Themes for ggplot2. DescTools Palettes function.
Make your own color palettes with paletti – That's so Random. Last week I blogged about the dutchmasters color palettes package, which was inspired by the wonderful ochRe package.
As mentioned I shamelessly copied the package. I replaced the list with character vectors containing hex colors and did a find and replace to make it dutchmasters instead of ochRe. This was pretty ugly. I realized that when we would refactor the ochRe functions, thus creating functions that create the functions, there would no longer be a need to copy-paste and find-and-replace. So that is what I did. Color palettes derived from the Dutch masters – That's so Random. Among tulip fields, canals and sampling cheese, the museums of the Netherlands are one of its biggest tourist attractions. And for very good reasons! During the seventeenth century, known as the Dutch Golden Age, there was an abundance of talented painters. If you ever have the chance to visit the Rijksmuseum you will be in awe by the landscapes, households and portraits, painted with incredible detail and beautiful colors.
The viridis color palettes. OchRe - Australia themed colour palettes. The second rOpenSci OzUnConf was held in Melbourne Australia a few weeks ago. A diverse range of scientists, developers and general good-eggs came together to make some R-magic happen and also learn a lot along the way. Before the conference began, a huge stack of projects were suggested on the unconf GitHub repo. For six data-visualisation enthusiasts, one issue in particular caught their eye, and the ochRe package was born. The ochRe package contains colour palettes influenced by the Australian landscape, iconic Australian artists and images. OchRe is originally the brain-child of Di Cook, who was inspired by Karthik Ram’s wesanderson package. CARTOColors. iWantHue. The yarrr package (0.0.8) is (finally!) on CRAN.
Great news R pirates! The yarrr package, which contains the pirateplot, has now been updated to version 0.0.8 and is up on CRAN (after hiding in plain sight on GitHub). Let’s install the latest version (0.0.8) and go over some of the updates: The most important function in the yarrr package is pirateplot(). What the heck is a pirateplot? A pirateplot is a modern way of visualising the relationship between a categorical independent variable, and a continuous dependent variable.
GitHub - Bart6114/artyfarty: ggplot2 theme presets. The Pirate Plot (2.0) – The RDI plotting choice of R pirates. Package update! Yesterday I updated the yarrr package and pirateplot() function with additional functionality. To see the updates, check out my latest post here. Introduction to ggthemes. Library("ggplot2") library("ggthemes") p <- ggplot(mtcars, aes(x = wt, y = mpg)) + geom_point() + ggtitle("Cars") p2 <- ggplot(mtcars, aes(x = wt, y = mpg, colour = factor(gear))) + geom_point() + ggtitle("Cars") p3 <- p2 + facet_wrap(~ am) Tufte theme and geoms Minimal theme and geoms based on plots in The Visual Display of Quantitative Information. p + geom_rangeframe() + theme_tufte() + scale_x_continuous(breaks = extended_range_breaks()(mtcars$wt)) + scale_y_continuous(breaks = extended_range_breaks()(mtcars$mpg))
Color Thief. The ggthemr package – Theme and colour your ggplot figures. Theming ggplot figure output The default colour themes in ggplot2 are beautiful. Your figures look great, the colours match, and you have the characteristic “R” look and feel. The author of ggplot2, Hadley Wickham, has done a fantastic job. For the tinkerers, there’s methods to change every part of the look and feel of your figures. In practice however, changing all of the defaults can feel laborious and too much work when you want a quick change to look and feel. The ggthemr package was developed by a friend of mine, Ciarán Tobin, who works with me at KillBiller and Edgetier. In this post, we will quickly examine some of the built in theme variations included with ggplot2 in R, and then look at the colour schemes available using ggthemr. Basic themes included in ggplot2. Psychology, decision making, statistics, R…and pirates.
Quantitate: Color Quantization in R. In this post, we'll look at a simple method to identify segments of an image based on RGB color values. The Elements of Choosing Colors for Great Data Visualization in R. Color extraction with R. Given all the attention the internet has given to the colors of this dress, I thought it would be interesting to look at the capabilities for extracting colors in R. R has a number of packages for importing images in various file formats, including PNG, JPG, TIFF, and BMP. Cttobin/ggthemr · GitHub. Zoom + Pan. Woobe/rPlotter. Wes Anderson color palette. I'm a big fan of Wes Anderson's movies.
I love the quirky characters and stories, the distinctive cinematography, and the unique visual style. Now you can bring some of that style to your own R charts, by making use of these Wes Anderson inspired palettes. Karthik/wesanderson. Towards (Yet) Another R Colour Palette Generator. Step One: Quentin Tarantino. Why? I love colours, I love using colours even more. Unfortunately, I have to admit that I don't understand colours well enough to use them properly.