
Biology - Homework and Study Help - Free help with your Biology homework. Can I take a course at HippoCampus for credit?
How do I enroll in a course at HippoCampus? Are there any fees to take your courses? How do I make a comment or ask a question? How do I get individual help with my homework assignment? What are the preferred texts? Z250 - Latin & Greek Roots Index. AP Biology. New AP Biology Curriculum Units. AP-lab-RESimulation. TMV Lab. AP Bio e-portfolio guidelines. Passport to the Animal Kingdom-Animal Phylum Activity.pdf. Coelom Modeling Activity.
AP- Lab- Cell Respiration Inquiry.pdf. AP- Lab-Photosynthesis Inquiry.pdf. Science Fair - T-Tests. Introduction: T-tests are a statistical means of understanding the differences between measured means.
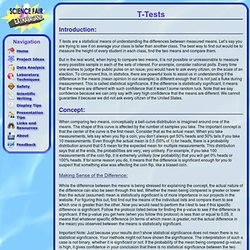
Let’s say you are trying to see if on average your class is taller than another class. The best way to find out would be to measure the height of every student in each class, find the two means and compare them. But in the real world, when trying to compare two means, it is not possible or unreasonable to measure every possible sample in each of the sets of interest. For example, consider national polls. Concept: When comparing two means, conceptually a bell-curve distribution is imagined around one of the means. Making Sense of the Difference: While the difference between the means is being stressed for explaining the concept, the actual nature of the difference can also be seen through this test. Important Note: Just because your results don’t show statistical significance does not mean there is no statistical significance. Excel - Population Pyramids. Population Pyramids Although Excel does not have a built-in population pyramid chart type it can be done...
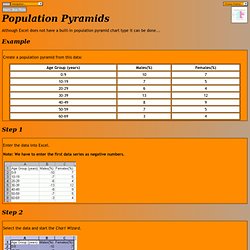
Example Create a population pyramid from this data: Step 1 Enter the data into Excel. Note: We have to enter the first data series as negative numbers. Step 2 Select the data and start the Chart Wizard. Step 3 Select 'Bar' as the chart type and 'Stacked Bar' as the sub-type. Step 4. STARS Virtual Instument Program. Hardy-Weinberg. The Hardy-Weinberg formulas allow scientists to determine whether evolution has occurred.
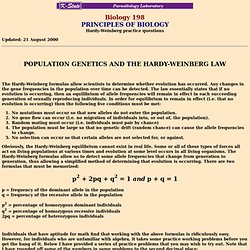
Any changes in the gene frequencies in the population over time can be detected. The law essentially states that if no evolution is occurring, then an equilibrium of allele frequencies will remain in effect in each succeeding generation of sexually reproducing individuals. In order for equilibrium to remain in effect (i.e. that no evolution is occurring) then the following five conditions must be met: Obviously, the Hardy-Weinberg equilibrium cannot exist in real life. Some or all of these types of forces all act on living populations at various times and evolution at some level occurs in all living organisms.
P = frequency of the dominant allele in the population q = frequency of the recessive allele in the population p2 = percentage of homozygous dominant individuals q2 = percentage of homozygous recessive individuals 2pq = percentage of heterozygous individuals PROBLEM #1. Geneticsproblems. Genetic Problems One trait cross Test Cross Sex-Linkage Answers to Problems "Back cross" Multiple Alleles ProbabilityIncomplete dominance Two Traits Part I- One Trait Crosses (Solutions) 1.
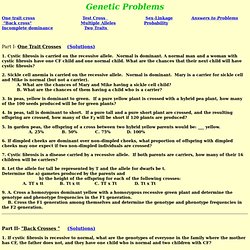
Cystic fibrosis is carried on the recessive allele. Normal is dominant. 2. 3. 4. VCISE : Drosophila. Biomedical Research & Science Education. Learn Science at Nature. The National Academies Press. A Global Science Community. K-12+, AP/IB, SAT Interactive vocabulary practice! AP Biology: Test Center. JeopardyLabs - Online Jeopardy Template. Biology Movie Worksheets. Biology Teaching & Learning Resources.
Mrs. Gay / FrontPage. Gallant's Biology Stuff. Everything you need for Biology 11, Biology 12, and AP Biology is right here on this page. The materials posted include complete class notes for each topic I teach in biology, as well as worksheets for biology, lab activities, and activities and assignments that we work on in class. You'll also find diagrams and images that we will discuss in class. In the SMART Notes section you'll find all the SMART Board lessons including annotations made to them during class. Before you can use the SMART notes you need to download and install the free SMART Board Notebook software (version 10.6).
Groch Biology Web Pages. Hawaii Baptist Academy Biology. Biology for Life. Interactive Concepts in Biochemistry - Interactive Animations. BioBuilder - Home. Biochemistry Pattern Matching I.docx. Biochemistry Pattern Matching II.docx. ENSI/SENSI: Evolution/Nat.of Sci.Home Page. 19 February 2017 ATTENTION, FILMMAKERS!
A chance to make a film about evolution and win a prize! Scientists and science educators of all stripes -- students, postdocs, faculty, and full- or part-time science communicators -- are invited to enter the Seventh Annual Evolution Video Competition, sponsored by the Duke Initiative for Science & Society, the Howard Hughes Medical Institute, the Society for the Study of Evolution, and the BEACON Center for the Study of Evolution in Action.
To enter, please submit a video that explains a fun fact, key concept, compelling question, or exciting area of evolution research in three minutes or less. Entries may be related or unrelated to your own research, and should be suitable for use in a classroom. MUSE - Natural Selection. Welcome to Natural Selection!
As you will soon discover, this is a very extensive web site. The general site map below is designed to give first-time visitors an idea of what lies ahead and to give returning users quick access to previously visited pages. At any time from any page within this web site, you can click on "site map" in the lower left corner to return to this page. Please note: NEXT PAGES (to your left) and PREVIOUS PAGES (on the top) are designed to help efficiently guide you through this complex site by showing you the most logical steps to and from your current page.
DNA Learning Center. Restriction Maps. A restriction map is a description of restriction endonuclease cleavage sites within a piece of DNA. Generating such a map is usually the first step in characterizing an unknown DNA, and a prerequisite to manipulating it for other purposes. Typically, restriction enzymes that cleave DNA infrequently (e.g. those with 6 bp recognition sites) and are relatively inexpensive are used to produce at a map. The DNA to be restriction mapped it usually contained within a well-characterized plasmid or bacteriophage vector for which the sequence is known. In fact, there are usually multiple known restriction sites immediately flanking the uncharacterized DNA, which facilitates making the map. In the following discussion, it is assumed that the unknown DNA has been inserted into a plasmid vector, but the principles can readily be applied to other situations.