The Anatomy Of An Infographic: 5 Steps To Create A Powerful Visual
Information is very powerful but for the most bit it is bland and unimaginative. Infographics channel information in a visually pleasing, instantly understandable manner, making it not only powerful, but extremely beautiful. Once used predominantly to make maps more approachable, scientific charts less daunting and as key learning tools for children, inforgraphics have now permeated all aspects of the modern world.
Infosthetics: the beauty of data visualization
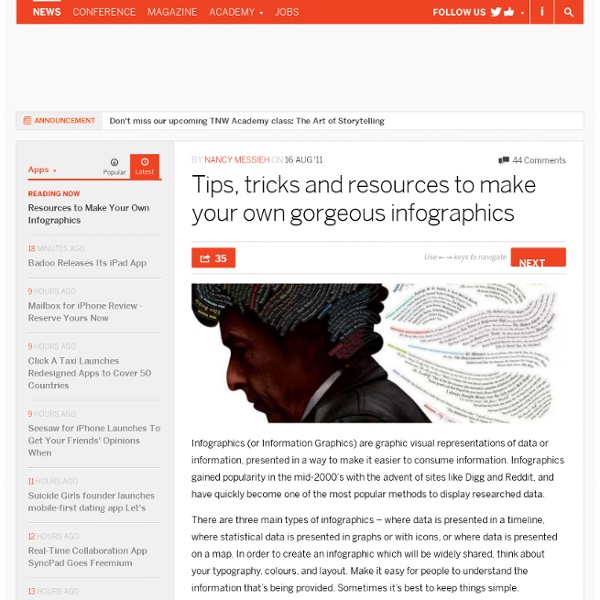
The beauty of information aesthetics: Visual Poetry 06 by Boris Müller. " Boris Müller's newest 'visual theme' for a annual international German literature festival. 2006 the theme consisted of beautiful visualizations of the poetry texts themselves. Each word corresponded to a numerical code by adding the alphabetical values of its letters together. This number was mapped onto the position on a circle, and marked by a red dot. Gray lines connect the dots in the sequence the words appear in the poem.
4 Simple Tools for Creating an Infographic Resume
This post originally appeared on the American Express OPEN Forum, where Mashable regularly contributes articles about leveraging social media and technology in small business. As a freelancer or job seeker, it is important to have a resume that stands out among the rest — one of the more visually pleasing options on the market today is the infographic resume. An infographic resume enables a job seeker to better visualize his or her career history, education and skills. Unfortunately, not everyone is a graphic designer, and whipping up a professional-looking infographic resume can be a difficult task for the technically unskilled job seeker. For those of us not talented in design, it can also be costly to hire an experienced designer to toil over a career-centric infographic.
15 Useful Infographics For Designers And Developers
Writen by Bogdan / Comments Off on 15 Useful Infographics For Designers And Developers Information graphics or infographics are graphic visual representations of information, data or knowledge. These graphics present complex information quickly and clearly,[1] such as in signs, maps, journalism, technical writing, and education. With an information graphic, computer scientists, mathematicians, and statisticians develop and communicate concepts using a single symbol to process information.
Statistical Visualization
For his book The Visual Miscellaneum, David McCandless, along with Lee Byron, had a look at breakups on Facebook, according to status updates. They looked for the phrase "we broke up because" in status updates, and then graphed the frequencies over time. Why they couldn't just look at updates to relationship status, I'm not sure.
Free Vector Infographic Kit
This week’s freebie is a huge vector set for creating infographics. Included in the package are over 50 elements, ranging from graphs and charts to maps and symbols. Let your infographic stand out with these bold and beautiful infographic resources. In the download the filetypes are AI, EPS and SVG so you can use this kit at any scale, easily edit the color scheme, and the data points. Enjoy!
indiemapper is free - Axis Maps Blog
by David Heyman on January 5, 2012 With the start of 2012, we’ve decided to make indiemapper free to use. Since indiemapper launched in 2010, our business has grown and changed to where supporting and maintaining indiemapper is no longer a major part of what we do at Axis Maps every day. We’re making indiemapper free so that it can continue to exist as a useful tool for map-makers while freeing us up to be as awesome as possible at our custom cartography business.
10 Steps To Designing An Amazing Infographic
Information can be useful—and even beautiful—but only when it’s presented well. In an age of information overload, any guidance through the clutter comes as a welcome relief. That’s one reason for the recent popularity of information graphics. Infographics are visual designs that help to explain complicated data in a simple way (mental-health emergencies at Burning Man, anyone?). But how are they created?
The Do's And Don'ts Of Infographic Design - Smashing Magazine
Advertisement Editor’s Note: You might want to read Nathan Yau’s article The Do’s And Don’ts Of Infographic Design: Revisited1 here on Smashing Magazine which is a response to this article. Since the dawn of the Internet, the demand for good design has continued to skyrocket. From Web 1.0 to Web 2.0 and beyond, designers have remained on their toes as they define the trends and expectations of our online universe. The Internet is a great designer’s playground, and online businesses are growing more and more appreciative of what can be gained from a bit of well-executed eye candy. Over the past two years, this fact has become the backbone of a growing trend in online marketing: the infographic.
40 Useful and Creative Infographics
Six Revisions Menu Main Categories CSS HTML JavaScript