
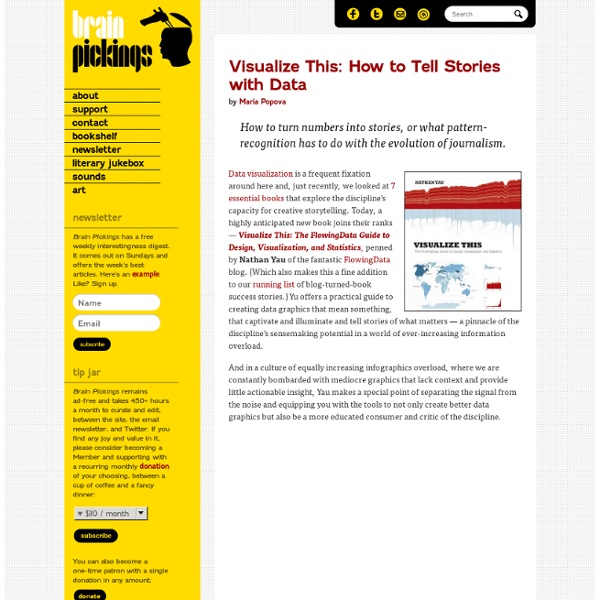
OpenBible.info Color as Data: Visualizing Color Composition by Maria Popova Abstracting glossy magazines, or what pie charts have to do with the Mona Lisa. We love data visualization and color. Computational artist Mario Klingemann, a.k.a. The pie charts represent the distribution of dominant colors within a circle area. Designer Shahee Ilyas‘ amusingly minimalist deconstruction of country flags by color composition is an absolute treat. Besides the playful irreverence, the project reveals some curious patterns of color choice, raising even more curious questions about color symbolism. Data viz superheroes Martin Wattenberg and Fernanda Viegas have taken their visualization magic to the world of fashion photography. To create the images in luscious, we began with a series of magazine advertisements for luxury brands. Brain Pickings has a free weekly newsletter and people say it’s cool. Share on Tumblr
Meet the Data Brains Behind the Rise of Facebook | Wired Enterprise Facebook’s Jay Parikh. Photo: Ariel Zambelich/Wired Jay Parikh sits at a desk inside Building 16 at Facebook’s headquarters in Menlo Park, California, and his administrative assistant, Genie Samuel, sits next to him. Parikh is Facebook’s vice president of infrastructure engineering. The trouble is that the Facebook infrastructure now spans four data centers in four separate parts of the world, tens of thousands of computer servers, and more software tools than you could list without taking a deep breath in the middle of it all. But that’s why Parikh and his team build tools like Scuba. “It gives us this very dynamic view into how our infrastructure is doing — how our servers are doing, how our network is doing, how the different software systems are interacting,” Parikh says. In the nine years since Mark Zuckerberg launched Facebook out of his Harvard dorm room — Monday marks the anniversary of the service — it has evolved into more than just the world’s most popular social network.
Digging Into the Relationships in Sunlight’s Twitter Lobbyist List Enquête 2014 sur l'utilisation de 529cbe2d9536f1ce41009dcf - Mardi, 08 Avril 2014 Question : 1 sur 4 Comment évalueriez-vous 529cbe2d9536f1ce41009dcf sur une échelle de 1 à 5 (1 étant la meilleure note) ? Question : 2 sur 4 À partir d'où utilisez-vous 529cbe2d9536f1ce41009dcf ? Question : 3 sur 4 Combien de fois utilisez-vous 529cbe2d9536f1ce41009dcf ? Question : 4 sur 4 Naviguez-vous sur 529cbe2d9536f1ce41009dcf sur votre téléphone mobile ? Envoi de réponses ... ©2014 All Rights Reserved. Your privacy is important to us.
FORM+CODE: Eye and Brain Candy for the Digital Age by Maria Popova Computational aesthetics, or what typography has to do with Yoko Ono and Richard Dawkins. Yes, we’re on a data visualization spree this week, but today’s spotlight taps into an even more niche obsession: data viz book candy. This season, Princeton Architectural Press, curator of the smart and visually gripping, brings us FORM+CODE — an ambitious, in-depth look at the use of software across art, design and illustration for a wide spectrum of creative disciplines, from data visualization to generative art to motion typography. The nature of form in the digital age is trapped in the invisible realm of code. Elegant and eloquent, compelling yet digestible, the tome — dubbed “a guide to computational aesthetics” — offers a fine piece of eye-and-brain stimulation for the age of digital creativity. Thanks, Julia Brain Pickings has a free weekly newsletter and people say it’s cool. Share on Tumblr
Wonga, Lenddo, Lendup: Big data and social-networking banking Photo by Johannes Simon/Getty Images The buzzword tsunami that is “big data"—a handy way of describing our vastly improved ability to collect and analyze humongous data sets—has dwarfed “frictionless sharing” and “cloud computing” combined. As befits Silicon Valley, “big data” is mostly big hype, but there is one possibility with genuine potential: that it might one day bring loans—and credit histories—to millions of people who currently lack access to them. But what price, in terms of privacy and free will (not to mention the exorbitant interest rates), will these new borrowers have to pay? In the not so distant past, the lack of good and reliable data about applicants with no credit history left banks little choice but to lump them together as high-risk bets. Thanks to the proliferation of social media and smart devices, Silicon Valley is awash with data. Similarly, the U.S. Social media is just the tip of the iceberg. Those without smartphones or Twitter accounts need not despair.
Symbol Signs: Helvetica Man and Beyond by Maria Popova A man and a woman walk into a sign, or what Helvetica has to do with slipping on ice. In 1974, the U.S. Department of Transportation commissioned AIGA to produce Symbol Signs — a standardized set of 34 symbols for the Interstate Highway System. Five years later, 16 more symbols were added to complete what’s become known as “the Helvetica of pictograms” — a 50-piece symbol set so iconic and universally pervasive it has become an integral part of our visual language. But beyond their practical application, Symbol Signs have amassed a cultish following in the design community, generating derivative work ranging from the quirky to the wildly creative. Artist Iain Anderson’s symbol-based short film, Airport, was a finalist in the 2005 Sydney Film Festival. A few weeks ago, we tweet-raved about Symbolic Gestures — a wonderful exposé on all the creative ways in which the National Park Service has adapted the iconic symbols to convey a wide and incredibly rich range of contexts.
7 Essential Books on Data Visualization & Computational Art by Maria Popova What 12 million human emotions have to do with civilian air traffic and the order of the universe. I’ve spent the past week being consistently blown away at the EyeO Festival of data visualization and computational arts, organized by my friend Jer Thorp, New York Times data artist in residence, and Dave Schroeder of Flashbelt fame. Processing, the open-source programming language and integrated development environment invented by Casey Reas and Ben Fry in 2001, is easily the most fundamental framework underpinning the majority of today’s advanced data visualization projects. Recommended by: Casey Reas Since 2005, (a longtime Brain Pickings favorite) have been algorithmically scrobbling the social web to capture occurrences of the phrases “I feel” and “I am feeling” harvesting human sentiment around them by recording the full context in which the phrase occurs. Reviewed in full here. Recommended by: Jer Thorp Recommended by: Moritz Stefaner Recommended by: Wes Grubbs
Top Five Big Data Trends For 2013 I can say this with absolute certainty: The holiday season will underscore the impact of big data on retail. Already, the early sales results begin to tell the story, pointing towards data-rich e-commerce as the big winner. From comScore: Black Friday alone saw $1.042 billion in online sales. That’s the first time online spending on the day after Thanksgiving has crested $1 billion, and it’s also a respectable 26 percent increase versus Black Friday 2011. Of course, now the question at the top of the agenda is this: Where will we go from here? Looking ahead, here are the big data trends I’m expecting in the New Year: More and different use cases. Enhanced collaboration and integration. Related Resources from B2C» Free Webcast: Four Ways To Improve Your Content Marketing Maturity Better insights. Amped up mobile wars. Increased scrutiny of privacy issues. That’s a brief synopsis of the major big data trends I see on the horizon.
Shapes for Sounds: A Visual History of the Alphabet by Maria Popova What the anatomy of your tongue has to do with ship flags and the evolution of human communication. I’m endlessly fascinated by the intersection of sight and sound and have a well-documented alphabet book fetish. So I absolutely love Shapes for sounds by Timothy Donaldson, exploring one of the most fundamental creations of human communication, the alphabet, through a fascinating journey into “why alphabets look like they do, what has happened to them since printing was invented, why they won’t ever change, and how it might have been.” While the tome is full of beautiful, lavish illustrations and typography — like 26 gorgeous illustrated charts that trace the evolution of spoken languages into written alphabets — it’s no mere eye candy. The alphabet is one of the greatest inventions; it has enabled the preservation and clear understanding of people’s thoughts, and it is simple to learn. Donating = Loving Brain Pickings has a free weekly newsletter. Share on Tumblr
Ernst Haeckel Un article de Wikipédia, l'encyclopédie libre. Ernst Hæckel Ernst Haeckel en 1860. Ernst Heinrich Philipp August Hæckel (Potsdam, le - Iéna, le ), était un biologiste, philosophe et libre penseur allemand. Il a fait connaître les théories de Charles Darwin en Allemagne et a développé une théorie des origines de l'homme. Ernst Haeckel contribua beaucoup par ses écrits à la diffusion de la théorie de l'évolution. Biographie[modifier | modifier le code] En 1857 et 1858, Ernst Haeckel obtint son doctorat de médecine, puis il obtint son autorisation d'exercer la médecine (Approbation). En 1861, après seulement une année de pratique, il obtint son habilitation et un poste de conférencier (Privat-docent) en anatomie comparée à l’université d'Iéna avant de devenir, l’année suivante professeur extraordinaire d’anatomie comparée à l’institut de zoologie de l’université. En 1862, il épousa sa cousine Agnès Sethe. En 1881-1882, il parcourut les mers tropicales et Ceylan.