
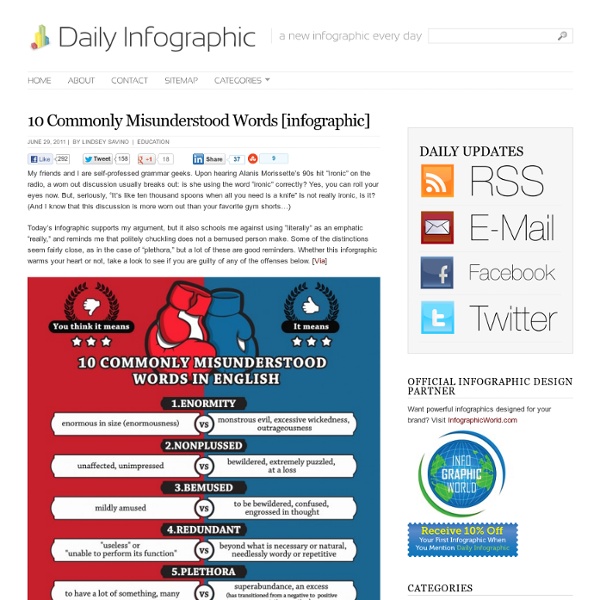
http://dailyinfographic.com/10-commonly-misunderstood-words-infographic
20 Examples Of Infographs That You Don’t See Every Day I think we all know what an infograph is, and nowadays they are increasingly popular. The bad thing is that almost all of them are becoming boring and very similar. In this article I have collected 20 infographs that are very unique design and also interesting subjects. Twitter Dots: Mapping all Tweets for a specific Keyword Twitter Dots translates individual tweets as simple dots on a geographical world map. 16 Facts About Sleep In order to start the week off right, I thought I would share an infographic very appropriate for a Monday, one entitled “16 Things You Didn’t Know About Sleep.” As I write this I think about how amazing sleep is and of those mornings when sleep is just too appealing to pass up. As we all know sleep is essential to life. It is one of the activities we will spend a large amount of our life engaged in. Sleeping works better than any medicine or home remedy, sleeping is the cure-all.
The Imperfections of the U.S. Judicial System I figured this infographic would be appropriate given the recent controversy in the Casey Anthony trial. Honestly I haven’t been following the coverage enough to form an opinion. But judging by my recent Facebook news feed, several of my friends have followed the trial and have quite a bit to say about it. Cisco Reminds Us Once Again How Big The Internet Is Getting - Arik Hesseldahl - Enterprise One of the well-worn buzz phrases in tech that re-surfaces from time to time is “The Internet of Things.” When I first encountered it, it was in 2002, and it was used in the title of this story in Forbes about the use of RFID chips by retailers like Wal-Mart to track inventory. Nine years later it draws a big yawn. Now it seems the networking giant Cisco Systems has appropriated it to mean something else entirely, something a lot more meaningful in the larger context of the Internet.
What Are The Hardest Languages To Learn? [INFOGRAPHIC] Learning a new language can be difficult, but some languages can be trickier than others. For native English speakers, the difficulty level of a new language depends on a variety of factors. So which are the most difficult to learn? And which languages would you be able to master in under a year? View the infographic below to learn more.
10 Astounding Infographics Comparing Money Matters Around the World 47 Flares Google+ 2 Twitter 31 Facebook 4 Reddit 1 StumbleUpon 1 Pin It Share 0 LinkedIn 8 inShare8 47 Flares × It goes without the saying that comparing wealth and spending in different countries is almost impossible: people work, earn and even spend differently – moreover, their ways of life and views can be too different to compare. However, we still try to compare because people move around the world and they want to know what they can expect in different corners of the globe. Here are the 10 greatest examples of information graphics comparing money, spending and earning around the world: 1.
Visualization All the buildings in Manhattan in 3-D map Taylor Baldwin mapped all of the buildings in Manhattan using a 3-D layout.… Get all caught up with The Avengers using this timeline It’s been a decade since the first Iron Man movie, and some 30… Top 3 Reasons to Spice Up Language Learning Evernote, the cross-platform note-taking and archiving service that helps users “remember everything”, is growing and expanding into the educational community. In particular, it has caught the eye of many language learners who, quite simply, want nothing more than to “remember everything” they have learned in and about their foreign languages of study. If you find yourself struggling with the Russian alphabet or German syntax, here are the top 3 reasons to spice up your own language learning odyssey with Evernote. 1.
Tipping Etiquette Around the World Growing up I never really understood the tip, it always seemed as though we were just paying twice for someone to do their job. However as I’ve gotten older I’ve realized tipping is a pretty important thing. After all these people are handling your food and other important things you don’t want them messing with/up. As a poor college student tipping sucks, but I do it even if it is just a dollar or two, a tip is a tip right? Today’s infographic Tipping Etiquette Around the World does a nice job of comparing the way people tip in different countries. Reading through the graphic you will find that North America has some of the highest tip percentages with the U.S.A. and Canada leading the way with 15-20%. Instant Hacking This is a short introduction to the art of programming, with examples written in the programming language Python. (If you already know how to program, but want a short intro to Python, you may want to check out my article Instant Python.) This article has been translated into Italian, Polish, Japanese, Serbian, Brazilian Portuguese, Dutch, Czech, and Belarusian. This page is not about breaking into other people’s computer systems etc.
How Star Wars Changed the World Hopefully reading this infographic will give you a nice break, writing about it has for me. I sit here amidst a slew of homework, from writing a paper on Rousseau and his Discourses to studying Chinese Politics. Now after finding this infographic, all I want to do is put everything away and watch Star Wars. Whether you are a fan of the double triology (? Sixology? Whatever you want to call it) or not, there is no doubt the series has permeated our society. The Forex Market Explained Although the stock market gets all the publicity, trading currencies in the Forex market is a little different than trading a regular company’s stock. The Forex market trades currency and trading goes on for 24 hours during 5.5 days-a-week. These hours of operation mean that the Forex market trades in 1 day what Wall St. trades in a month.
Visualize This: How to Tell Stories with Data by Maria Popova How to turn numbers into stories, or what pattern-recognition has to do with the evolution of journalism. Data visualization is a frequent fixation around here and, just recently, we looked at 7 essential books that explore the discipline’s capacity for creative storytelling. Today, a highly anticipated new book joins their ranks — Visualize This: The FlowingData Guide to Design, Visualization, and Statistics, penned by Nathan Yau of the fantastic FlowingData blog.