
Klayre K.
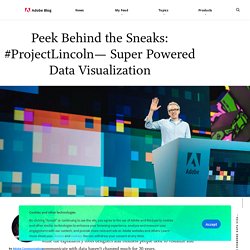
Peek Behind the Sneaks: #ProjectLincoln— Super Powered Data Visualization. It’s an understatement to say that we live in a world of data.
It informs practically everything we experience in the world, from headlines in the news to the world of business. The tools we use for data analysis and exploration have become increasingly sophisticated while the explanatory tools designers and business people need to visualize and communicate with data haven’t changed much for 20 years. Well known UI researcher and visualization expert, Bret Victor, has pointed out that we currently have one of three options to create a data visualization. Charticulator. Data Illustrator: Create infographics and data visualizations without programming. Travel Visa Inequality - How fair are travel visas distributed ?
Travel Visa Inequality This project is a personal project by Christian Laesser.

A vacation in Thailand made me curious about how equal travel visas are distributed between different countries. My intention of this project was to raise awareness for existing inequalities between different countries knowing that this problem is only one example of inequality around the globe. Subject. Information is Beautiful. Data made insightful, effective & beautiful through visualization. Dueling Data: Finding the Right Color Palettes for Data Visualizations. Design - Medium. Wind and Words: an interactive Game of Thrones data visualization. Mr. Mint : Apprendre le Machine Learning de A à Z. PixieApps — PixieDust Documentation. Pandas: powerful Python data analysis toolkit — pandas 0.23.4 documentation.
Pandas is a Python package providing fast, flexible, and expressive data structures designed to make working with “relational” or “labeled” data both easy and intuitive.
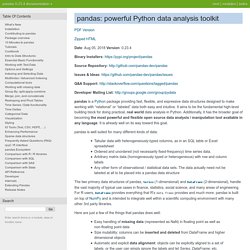
It aims to be the fundamental high-level building block for doing practical, real world data analysis in Python. Additionally, it has the broader goal of becoming the most powerful and flexible open source data analysis / manipulation tool available in any language. It is already well on its way toward this goal. The two primary data structures of pandas, Series (1-dimensional) and DataFrame (2-dimensional), handle the vast majority of typical use cases in finance, statistics, social science, and many areas of engineering. SciPy — SciPy v1.1.0 Reference Guide. Dc.js - Dimensional Charting Javascript Library. Dc.js - Dimensional Charting Javascript Library dc.js is a javascript charting library with native crossfilter support, allowing highly efficient exploration on large multi-dimensional datasets (inspired by crossfilter's demo).

It leverages d3 to render charts in CSS-friendly SVG format. Raphaël—JavaScript Library. What is it?
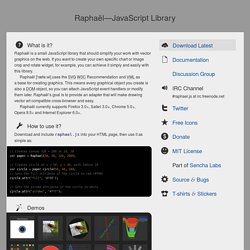
Raphaël is a small JavaScript library that should simplify your work with vector graphics on the web. If you want to create your own specific chart or image crop and rotate widget, for example, you can achieve it simply and easily with this library. Raphaël ['ræfeɪəl] uses the SVG W3C Recommendation and VML as a base for creating graphics. This means every graphical object you create is also a DOM object, so you can attach JavaScript event handlers or modify them later. Raphaël’s goal is to provide an adapter that will make drawing vector art compatible cross-browser and easy. D3plus. D3.js - Data-Driven Documents. Open source HTML5 Charts for your website. A Visualization Grammar. Vega is a visualization grammar, a declarative language for creating, saving, and sharing interactive visualization designs.
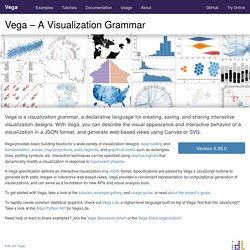
With Vega, you can describe the visual appearance and interactive behavior of a visualization in a JSON format, and generate web-based views using Canvas or SVG. Version 4.3.0 Vega provides basic building blocks for a wide variety of visualization designs: data loading and transformation, scales, map projections, axes, legends, and graphical marks such as rectangles, lines, plotting symbols, etc. Interaction techniques can be specified using reactive signals that dynamically modify a visualization in response to input event streams. A Vega specification defines an interactive visualization in a JSON format. To get started with Vega, take a look at the tutorials, example gallery, and usage guide, or read about the project’s goals.
Popular Blocks. Online course on data visualization analysis, design & construction with D3.js. Color Lisa - Color palette masterpieces of the world’s greatest artists. TPG – Digital Accessibility Solutions. Features WCAG 2.1 compliance indicatorsSeveral ways to set colours: raw text entry (accepts any valid CSS colour format), RGB sliders, colour picker (Windows and macOS only)Support for alpha transparency on foreground coloursColour blindness simulator Support and development For questions concerning the Colour Contrast Analyser (CCA), or to report bugs, suggest improvements, and contribute to the code, see the Colour Contrast Analyser (CCA) repository.
Previous versions The current version of the Colour Contrast Analyser (CCA) has been rebuilt from the ground up using Electron. This program is distributed in the hope that it will be useful, but WITHOUT ANY WARRANTY; without even the implied warranty of MERCHANTABILITY or FITNESS FOR A PARTICULAR PURPOSE. Colorpicker for data. Do Your Slides Pass the Glance Test? An audience can’t listen to your presentation and read detailed, text-heavy slides at the same time (not without missing key parts of your message, anyway).

So make sure your slides pass what I call the glance test: People should be able to comprehend each one in about three seconds. Think of your slides as billboards. When people drive, they only briefly take their eyes off their main focus — the road — to process billboard information. Similarly, your audience should focus intently on what you’re saying, looking only briefly at your slides when you display them. Keep It Simple Research shows that people learn more effectively from multimedia messages when they’re stripped of extraneous words, graphics, animation, and sounds. So when adding elements to your slides, have a good reason: Does the audience need to see your logo on each slide to remember who you work for? It’s also important to stick to a consistent visual style in your slide deck. Open Color. iWantHue. D3 Color Schemes. Coolors.co - The super fast color schemes generator.
Colours. TranslatingColours. Colorgorical. To generate a palette with n colors, just enter the number of colors you want and click Generate.
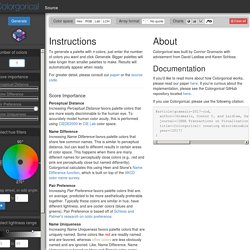
Bigger palettes will take longer than smaller palettes to make. Results will automatically appear when ready. For greater detail, please consult our paper or the source code. Score Importance Perceptual Distance Increasing Perceptual Distance favors palette colors that are more easily discriminable to the human eye. Name Difference Increasing Name Difference favors palette colors that share few common names. Pair Preference Increasing Pair Preference favors palette colors that are, on average, predicted to be more aesthetically preferable together. Name Uniqueness Increasing Name Uniqueness favors palette colors that are uniquely named. Select hue filter You can limit which colors are selected by either dragging over the wheel to select a hue range, or by entering the angles manually (e.g., select only reds).
Select lightness range. Free tools for working with digital colors. Colordot - A color picker for humans. ColorBrewer: Color Advice for Maps. Color Wheel - Color Calculator. 0to255 – A color tool for finding lighter and darker colors based on any color. Color schemes. The ultimate color combinations cheat sheet. Finding a correct color combination is one of the most important steps in designing a stylish and holistic look.
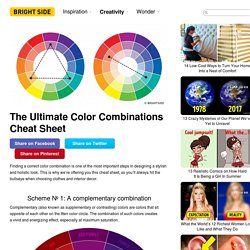
This is why we’re offering you this cheat sheet, so you’ll always hit the bullseye when choosing clothes and interior decor. Color Trends + Palettes. Coolors.co - The super fast color schemes generator.