Infographics. INFOGRAPHIE. Infographics. Infographic & Flowchart. Infographie. Infographics. COLLECTION: Infographic Information & Creation. Créer des infographies. COLLECTION: Infographics. INFOGRAPHICS. Infografiche. Learn something new everyday.
Infographic. InfoVis. Création. Infographie. Infographic/Image-Based/Visual Creation Tools. Information is Beautiful. Infographics Made By Adioma Users - Real Examples. Infographics Archives - McCrindle. Interactive Infographic - 13 Reasons Why Your Brain Craves Infographics. Infographic: 72 Ways To Think & Present Your Ideas. Infographics as a Creative Assessment.
19 Warning Signs Your Infographic Stinks. It sounds so good.

You create an infographic. It drives traffic. Builds links. Raises brand awareness. Unfortunately, it doesn’t always work like that. Many infographics are languishing in the dark corners of the web. What can you do to avoid that fate? We’ve collected the 19 most common mistakes that make infographics lackluster, neglected, and miserable.
Let’s start with eight warning signs you’ve picked the wrong idea. How to avoid choosing the wrong infographic idea 1. Instead, share interesting statistics about your industry, use humor to entertain, or provide in-depth buying advice such as: Explain the key features people need to consider when buying your product;Comment on your industry’s history or future;Show how your product is made;Share bizarre or fascinating facts about your industry;Compare products to help people make a choice;Show geographic, gender, or economic differences in the use of your product. Don’t take yourself too seriously. 2. Don’t imitate. 3. 4. 5. 6. 7. 8. 9. Adioma un nouvel outil pour créer des infographies rapidement et facilement.
Vous souhaitez réaliser des infographies simples, le tout rapidement et sans avoir besoin de Photoshop...
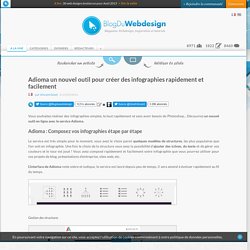
Découvrez un nouvel outil en ligne avec le service Adioma. Kinzaa. 17 incredible tools for creating infographics. Infographic makers will enable you to transform mountains of data into easy-to-read visuals. Information is much more accessible when presented in a well-designed infographic rather than dense reams of data, so people are likely to be much more engaged with the subject. However, it can be time-consuming to put them together. To help you out with that, we've handpicked a range of top infographic maker tools and apps – including paid-for and free options. Even the free options are surprisingly capable, and many are also aimed at non-designers or complete beginners.
Make Free Infographics, Reports & Charts Online. Free Infographic Maker - Venngage. Infographic Maker Guide: 20 Cool Infographic Creator Tools That Will Turn You Into A Designer. Create Infographics online. How to make infographics: a beginner’s guide to data visualisation. As a growing number of international NGOs are using infographics, charts and interactive maps to share success and highlight disaster, how can organisations with less resources create high quality visualisations without having to pay to outsource them?
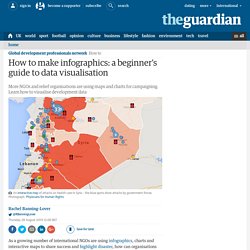
We’ve put together a beginner’s guide for visualising development data. Organising your data The first thing you need to do is have a clear idea of the data you want to visualise. Are you trying to highlight a particular disparity between money spent in one place and another? Are you trying to show a volume of activity going on in one location? Let’s imagine I’m running a campaign calling for better sanitation worldwide. While I have data for over 10 years, I just want the figures for 2000 and 2012, so the first thing I need to do is remove any irrelevant columns and rows (tip: save a separate copy of the original first).
Before... Piktochart: Infographic and Presentation Tool for Non-Designers. 10 sites pour créer une infographie. Les infographies permettent de visualiser plus facilement un ensemble de données parfois complexe. Formation Community Manager & Formation Réseaux Sociaux - Pellerin Formation. Pour diversifier votre communication sur les réseaux sociaux, vous pouvez miser sur les infographies. Sur Pinterest, Twitter ou Facebook, ces visuels riches sont très populaires. 10 Fun Tools To Easily Make Your Own Infographics. People love to learn by examining visual representations of data. That’s been proven time and time again by the popularity of both infographics and Pinterest.
So what if you could make your own infographics ? What would you make it of? It’s actually easier than you think… even if you have zero design skills whatsoever. Below are my two favorite infographic-making web 2.0 tools that I highly recommend. Click the name of each tool to learn more! Visual.ly. 10 free tools for creating infographics. Done right, infographics can be a great way to make sense of complex data.
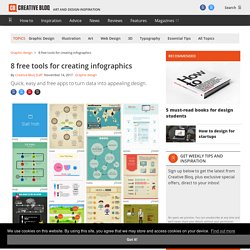
The best infographics transform complex information and data into graphics that are both easy to grasp and visually appealing. The only problem is, infographics that look like they were simple to make are often anything but. Exclusive offer: Save 15% on Adobe Creative Cloud now Here, we've selected our top free tools and apps for making infographics. Some of the options here are even suitable for non-designers, as templates and other features make them easy to use.
Give these free tools a try and let us know which ones you get on best with on Facebook or Twitter. 01. 20+ Tools to Create Your Own Infographics. A picture is worth a thousand words – based on this, infographics would carry hundreds of thousands of words, yet if you let a reader choose between a full-length 1000-word article and an infographic that needs a few scroll-downs, they’d probably prefer absorbing information straight from the infographic.
What’s not to like? Colored charts and illustrations deliver connections better than tables and figures and as users spend time looking back and forth the full infographic, they stay on the site longer. 42 ressources et logiciels pour créer une infographie. Quatre sites pour créer gratuitement des infographies. General. Make Beautiful Infographics. Dataseed Interactive Data Visualization. Infographics. Graphs Infographics. Créer des infographies. Infographies. 6 outils pour créer vos infographies facilement via. Les infographies ont du succès, peut être souhaitez-vous créer les vôtres ?
Des outils simples sont à disposition sur la toile. Je vous ai déjà parlé de quelques outils dans différents articles (ceux d’Intel ou de Visual.ly), voici une sélection de 5+1 outils pour utiliser et dynamiser vos données. Infographics, Apps & Fun. The Infographics Gallery. WWW Visualization & Infographics. Cool Infographics - Blog. Infographicworld.com. A Dumbass’s Guide to the Super Bowl [infographic] January 31, 2014 by infographicworld Don’t know much about football?
We can help. Infographics. Infographics. Infographics. 10 Awesome Free Tools To Make Infographics. Advertisement Who can resist a colourful, thoughtful venn diagram anyway?

In terms of blogging success, infographics are far more likely to be shared than your average blog post. This means more eyeballs on your important information, more people rallying for your cause, more backlinks and more visits to your blog. In short, a quality infographic done well could be what your blog needs right now. 9 Powerful Free Infographic Tools To Create Your Own Infographics - DATA VISUALIZATION. How To Create Outstanding Modern Infographics. In this tutorial you will learn that data doesn't have to be boring, it can be beautiful!

Learn how to use various graph tools, illustration techniques and typography to make an accurate and inspiring infographic in Adobe Illustrator. Start by using the Rectangle Tool (M) to draw a shape. Give it a subtle radial gradient too. The entire design is based on a grid of four columns. To make the columns first select the rectangle and drag a guide onto the centre of the shape. Condense the shape so it fits within the left-most guide and centre guide. Infographic Generator - Best Online infographic creator and maker. Best Infographics Ideas and Free Tools. Look at pretty much every blog, professional site and presentation these days, and you will notice that most of them have infographics, which are charts that display a visual image in order to supply data to the user.
They are highly functional and often work more effectively than graphs and charts alone. They are also more pleasing to the eye and can break down concepts for easier understanding. But for every good one, there is a bad one that looks cluttered and doesn’t manage to get the point across. Over 100 Incredible Infographic Tools and Resources (Categorized) This post is #6 in DailyTekk’s famous Top 100 series which explores the best startups, gadgets, apps, websites and services in a given category.

Total items listed: 112. Time to compile: 8+ hours. Follow @DailyTekk on Twitter to make sure you don’t miss a week! Update: Be sure to check out our latest post on infographics: Infographics Are Everywhere – Here’s How to Make Yours Go Viral. 25+ Creative Infographics That will make you Look Twice. Infographics, provide a great way to visualize a topic that would be hard to understand when reading. Infographics are present to us in media sources like magazines, television, books, posters, signs, and anything else that has complex information. Let’s be honest, we tend to get bored with reading too much text and it’s rather difficult to understand descriptive information especially if they signify numbers or statistics.
To make things easier, we use graphs, illustrations and flowcharts to make them visually appealing yet, at the same time, easy to understand. So here is a creative showcase of well designed infographics for your inspiration. Infographicworld. Cool Infographics. Plus de 700 infographies sur webilus.fr ! En une seule minute, une quantité monstrueuse de données est échangée sur le web. Chaque minute de chaque heure de chaque journée. The 90 best infographics. Every picture tells a story, as they say, but sometimes it takes a clever combination of words and pictures to tell a story quickly, concisely and in an entertaining fashion. The best infographics may look like they were simple to create in Photoshop, but designing an effective piece of data visualization is usually anything but.
There are several great tools to create infographics, but these examples of infographics from around the web will show you how you can take it a step further and add a bit of style and personality to your data. Some are older than others, but they can still provide some inspiration for those of you looking to create an infographic from scratch. Some are funny, some more serious, and all are inspiring examples of the art. If Star Wars: The Last Jedi has put you in the mood to immediately watch the original movie, hold your horses just one second. 02. 35 Great Social Media Infographics. 35 Great Social Media Infographics [Note: I recently updated this compilation to include some more recent visualizations... you can see it here.] Here’s a collection of terrific social media infographics that might come in handy. As you probably know, infographics are visual representations of information, data, or knowledge.
They illustrate information that would be unwieldy in text form and they act as a kind of visual shorthand, making information easy to understand and consume. They are driven by the same information as charts, but they’re often a better form of communication because of their pleasant aesthetics — charts and graphs can communicate data, but infographics turn data into information. 40 Useful and Creative Infographics. Six Revisions Menu Main Categories CSS HTML JavaScript Web Design WordPress Web Development Design Inspiration UX Design UI Design. InfoGraphics (Visual Maps) 10 sites pour créer une infographie. Les infographies permettent de visualiser plus facilement un ensemble de données parfois complexe.
Une image est parfois plus parlante qu’un long discours ! Elles permettent de comprendre en un coup d’œil les principaux enseignements d’une étude quantitative par exemple. Infographics. Data visual. How to Create an Awesome Infographic. Diagrams & charts tools. Diagrammr. yEd - Graph Editor. yEd is a powerful desktop application that can be used to quickly and effectively generate high-quality diagrams. Create diagrams manually, or import your external data for analysis. Our automatic layout algorithms arrange even large data sets with just the press of a button. yEd is freely available and runs on all major platforms: Windows, Unix/Linux, and Mac OS X.
The latest release is version 3.12.2. Diagramly - Draw Diagrams Online. Create free online charts with ChartGizmo. How to Guide: Creating Infographics for B2B Social Media Marketing. Popular Today in Business: All Popular Articles Flowcharts. Diagrams. Pie charts. Chartle. Infographies : 4 astuces pour ajouter de l'animation. Pour communiquer, pour informer ou juste pour profiter de leur viralité, vous avez déjà très certainement inclus des infographies sur vos sites web ou dans vos publications. Vous savez qu’elles constituent un moyen visuel très efficace de partager des chiffres. Malgré tout, ces infographies ont encore un défaut : elles sont un peu statiques. Infographics - Marketing. Information aesthetics - Data Visualization & Information Design. Infographs. Online Diagram Software and Flowchart Software - Gliffy.
How To Create Outstanding Modern Infographics. Visual.ly. The Do's And Don'ts Of Infographic Design - Smashing Magazine. Make Your Own Infographic. Create and share visual ideas online. The Anatomy Of An Infographic: 5 Steps To Create A Powerful Visual. Infoactive. Tips in Designing Effective Infographics. How To Design Your Own Infographics. Texte et mots. CALLIGRAMMES. WordSift 2. WordArt.com - Word Cloud Art Creator. Wordclouds. Un autre outil pour créer des nuages de mots.