The 60 best infographics
Best infographics: Quick links The best infographics can take dry data, complex information or a confusing timeline, and make a clear as crystal graphic which is a joy to look at. Infographics are almost the perfect encapsulation of what good design, illustration and animation are about: communicating a story or an idea visually, in a way that instantly connects with people, in a way that a lot of raw text can never do. If you're looking to create infographics yourself, then you'll probably want to look at our visualisation tools list. But before you get started, check out our selection of the best infographics on the web today, to get inspiration, ideas and motivation.
BeFunky
Whether you remove the object with our {{cutout_tool}} or use the {{clone_tool}} to cover it up, BeFunky Plus has the tools you need to remove anything from any photo. Take unique to the next level. BeFunky Plus has a collection of {{artsy_effects}} that’ll transform your photos into cartoons, paintings, sketches, and more! With {{batch_processing}} you can crop, resize, and edit hundreds of photos all at the same time. Watch it in action Use our {{fill_light}}, {{vibrance}}, and {{clarity}} tools to fine tune your photos, or let our intuitive {{Enhance DLX}} tools analyze your photos and fix them where they need to be fixed.
Infographic Template - Infographic Layout
Last updated: March 03, 2016 Please read these Terms and Conditions carefully before using the www.mindthegraph.com website, operated by Mind the Graph LLC ("us", "we"). This Terms of Use describes how visitors and users of Mind the Graph (www.mindthegraph.com) are allowed to use the content of the website and under which conditions they can use the online editor to create its own content. By visiting, remaining on this site and using the editor, you are agreeing to our Terms of Use, if you do not agree with any of these terms, please do not access this site or use the online editor.
Hungarian Christmas Gingerbread Recipe
Ingredients: 1 kg flour4 dl powdered sugar2 tsp. baking sodapinch of salt20 dkg butter3 whole eggs3 dl honey2 tbsp. cinnamon, ground clovesTo decorateegg white6 tbsp. powdered sugar Preheat oven to 160°C. Grease and flour the baking sheet.
How to Create Infographics in Under an Hour [15 Free Infographic Templates]
Wouldn't it be great if creating infographics was as simple as writing regular old text-based blog posts? Unfortunately, making visual content like this usually takes a lot more time, effort, and let's face it -- skill -- than the written word. Usually. But considering the popularity and effectiveness of visual content in marketing today, you can't just afford to throw in the towel.
16 incredible tools for creating infographics
Infographic makers will enable you to transform mountains of data into easy-to-read visuals. Information is much more accessible when presented in a well-designed infographic rather than dense reams of data, so people are likely to be much more engaged with the subject. However, it can be time-consuming to put them together. To help you out with that, we've handpicked a range of top infographic maker tools and apps – including paid-for and free options. Even the free options are surprisingly capable, and many are also aimed at non-designers or complete beginners.
Designing Effective Infographics
As the ways we collect data and the tools we use to analyze it evolve, our world is becoming incredibly data-rich. One of the most exciting challenges designers face in an increasingly quantitative world is how to translate data into a medium that is easily understood by a wide audience. Information graphics (better known as infographics) are a powerful storytelling tool that allows users to comprehend, analyze, and explore data.
Easily create awesome infographics online - for free!
Create awesome infographics like a pro from our free templates or from scratch with Biteable, the world’s most simple online infographic video maker. This how-to guide will show you how to make infographics or data visualizations from our huge library of vector or footage scenes. Step one
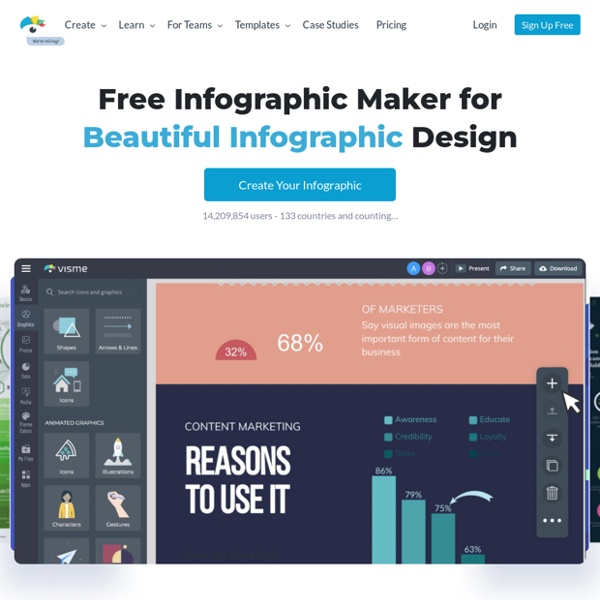
Free Infographic Maker
Adding a logo to your content means your brand will be recognized anywhere you share or embed it. The Infogram logo will automatically appear at the bottom of all projects created with our Basic and Pro plans. However, with the Business, Team, and Enterprise plans, you can disable Infogram branding and upload your own logo, if necessary. To do that: 1.