
Certified Corporate Financial Planning & Analysis Professional (FP&A) Building a Financial Model. Install the BPM Excel add-in, then take the following steps to convert financial statements (or Xero data) into an integrated 3-way financial model.
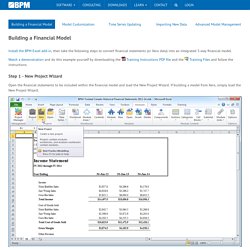
Watch a demonstration and do this example yourself by downloading the Training Instructions PDF file and the Training Files and follow the instructions. Step 1 - New Project Wizard Open the financial statements to be included within the financial model and load the New Project Wizard. Step 2 - Project Type Selection Select the project type most suitable for the business to be modeled, allowing for different charts of accounts and levels of complexity. Step 3 - Time Series Assumptions Specify the initial periodicity and time frames of the model. Step 4 - Model Functionalities Specify the ways in which different areas within the financial model will initially be forecast.
Step 5 - Source Data Selection Specify the source of the historical financial statements data to be initially included in the model. Financial Modelling Fundamentals. Index of Help for Excel functions, graphs and testing. Financial-Modelling.net - Tutorials, Courses, Trainings, Jobs and more. Find and share free financial models - docstoc. Introduction to Excel Financial Modeling - What is a Financial Model and how to build one? Posted on July 21st, 2010 in Featured , Financial Modeling , Learn Excel - 43 comments This is a guest post written by Paramdeep from Pristine.
Chandoo.org is partnering with Pristine to bring an excel financial modeling online training program for you. Financial Modelling Domain - Fimodo. European Spreadsheet Risks Interest Group - spreadsheet risk management and solutions conference. The FAST Standard Organisation Data Tables & Monte Carlo Simulations in Excel – A Comprehensive Guide. Posted on May 6th, 2010 in All Time Hits , Analytics , Charts and Graphs , Excel Howtos , Featured , Huis , Learn Excel , Posts by Hui , simulation - 162 comments This is a Guest Post by Hui, an Excel Ninja and One of the Moderators of our Forums.
Please note that this post is unusually large by Chandoo.org standards. If anybody asks me what is the best function in excel I am drawn between Sumproduct and Data Tables, Both make handling large amounts of data a breeze, the only thing missing is the Spandex Pants and Red Cape! How often have you thought of or been asked “I’d like to know what our profit would be for a number of values of an input variable” or “Can I have a graph of Profit vs Cost vs …” This post is going to detail the use of the Data Table function within Excel, which can help you answer those questions and then so so much more. How often have you thought “I’d like to know what our profit would be for a +/- 10, 20 and 30 % variance in the costs” ? Business Intelligence trial software and demos for small and medium business.
What is financial analytics ? - Definition from WhatIs.com. Welcome to the community of GARP Affiliate Membership. Welcome to the community of GARP Affiliate Membership.
Your choice to become an Affiliate member of this risk-aware community reflects an interest in understanding the issues surrounding managing risk, and a desire to connect with relevant information and with other risk professionals. As an Affiliate Member, you are entitled to certain benefits not available to those outside the GARP community, and will begin receiving valuable emails like Chapter meeting invitations, the Daily News and the Week in Risk immediately.
In order to take advantage of your benefits, we recommend taking a few moments to set up your membership so that it works to your advantage: Bookmark this page. It will serve as your reference point for an up-to-date snapshot of Affiliate benefits. Now that you've taken the first steps to enjoying the advantage of GARP Affiliate status, you'll want to explore the rest of your benefits. Don't forget! To upgrade your Membership, click here or contact Membership. Certificate Program. FREE site registration entitles you to: Exclusive Risk Management News and Market Data Research and White Papers Daily News Alert Leadership & Research Webcasts GARP Digital Library.
Course_biz0710_whittier. Free training. [share_ebook] Mastering Financial Modelling in MS Excel (pdf) Section), Please Wait For 5-8 Second.
![[share_ebook] Mastering Financial Modelling in MS Excel (pdf)](http://cdn.pearltrees.com/s/pic/th/mastering-financial-modelling-32875165)
Then You Can Click On Skip Ads! Button. With every major choice we face we "run through the numbers" to guide our decision-making and legitimise the outcomes. Financial modelling helps managers to make more informed decisions and, crucially, win corporate commitment for those decisions. The ability to construct useful financial models with speed and accuracy is becoming a key skill for all executives to master. However, this is a skill few managers and businesses know how to develop. This is the ultimate book and disk combination that will help finance professionals and business students alike to become more proficient in building Microsoft Excel models and applying corporate finance concepts. The Mastering Series are your practical guides to gaining the knowledge you need to succeed in the financial world. PDF | 391 Pages | 6.18 MB Download.