
Judith Curry Sea Level Series. Kip Hanson Sea Level Series. Reasons for Changes in Sea Level. Sea Level Acceleration. SeaLevel.info. Sea Level Change in Specific Locations. Sea Level Long-Term History. Sea Level Models and Observations. Predictions: Sea Level.
Gains and Losses in Shorelines. Sea Level Rise - Drowning Islands. Sea Level - Coral Reefs. Sea Level Rise - Mangroves and Marshes. Sea Level Rise - World Heritage Sites. Fake News about Sea Level. Sea level rise and Antarctica. What’s Natural Guest post by Jim Steele California’s and other American coastal towns are engaged in divisive arguments regards rising sea levels.
Although observed sea levels rose less than 8 inches (0.08 inches per year) since 1900, some modelers forecast much bleaker futures. They predict a 2.4-foot rise for every 1°F rise above preindustrial temperatures, then accelerating to nearly 4.5 feet for every 1°F additional increase. Why a dramatic acceleration in sea level? Those models have prompted some citizens to argue we must abandon the coasts via managed retreat. There are good reasons toquestion catastrophic models.
Up to a point, increasing greenhouse gases act like a blanket that warms your body by slowing your loss of body heat. Still, researchers do observe regions of retreating ice. Strong winds also cause turbulence that sporadically pulls warmer air from above down to the cold surface resulting in occasional “warming” spikes. Like this: Like Loading... Related September 26, 2018. SeaLevel.info - Mean Sea Level.
The mean sea level (MSL) trend at Wismar, Germany is +1.43 mm/year with a 95% confidence interval of ±0.11 mm/year, based on monthly mean sea level data from 1866/1 to 2015/12.
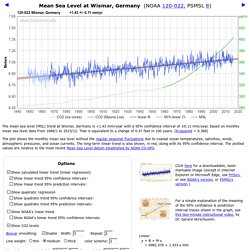
That is equivalent to a change of 0.47 feet in 100 years. (R‑squared = 0.368) The plot shows the monthly mean sea level without the regular seasonal fluctuations due to coastal ocean temperatures, salinities, winds, atmospheric pressures, and ocean currents. The long-term linear trend is also shown, in red, along with its 95% confidence interval. Sea Level Trends - NOAA Tides & Currents. New website gives you the real deal on sea level rise and rates. New analysis and graphing tools for sea-level data at SeaLevel.info Guest essay by David Burton now has interactive regression analysis (line/curve fitting) and visualization (graphing) tools available for mean sea level (MSL) measurements from over 1200 tide gauges, plus spreadsheets which combine various subsets of that data.

This article is intended as a primer, for how to use these new tools. But first, a few notes: Note #1: This is a work in progress. Note #2: These tools are my free contribution to the community. Note #3: These tools are ideologically neutral. One of the inspirations for this site was Paul Clark’s famous WoodForTrees, which provides some similar tools for temperature data. The data shows what the data shows, regardless of my opinions, Paul’s, or anyone else’s. The clever ruse of rising sea levels. Alarmists try to frighten people, and stampede them into terrible energy decisions Jay Lehr and Tom Harris.
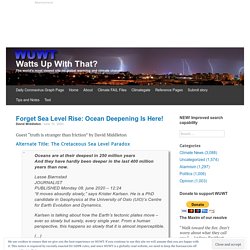
Sea Level Rise; A Major Non-Existent Threat Exploited by Alarmists and Politicians. Forget Sea Level Rise: Ocean Deepening Is Here! Guest “truth is stranger than friction” by David Middleton Alternate Title: The Cretaceous Sea Level Paradox Oceans are at their deepest in 250 million yearsAnd they have hardly been deeper in the last 400 million years than now.Lasse BiørnstadJOURNALISTPUBLISHED Monday 08. june 2020 – 12:24“It moves absurdly slowly,” says Krister Karlsen.
He is a PhD candidate in Geophysics at the University of Oslo (UiO)’s Centre for Earth Evolution and Dynamics.Karlsen is talking about how the Earth’s tectonic plates move – ever so slowly but surely, every single year. From a human perspective, this happens so slowly that it is almost imperceptible.[…]The world map 200 million years ago shows all the continents assembled in the supercontinent of Pangaea, a time when dinosaurs were well on their way to dominating the Earth’s landmasses.Since then, the continents have been shifting farther and farther apart, and now they may be as far apart as they can be, says Karlsen. “How about that, geology fans?” CO2 Rise ≠ Sea Level Rise. This recent paper is very topical, since several US coastal states are suing oil companies for damages expected from rising sea levels.

Some Alaskan teenagers are making similar claims in a separate lawsuit against the US federal government. The study is Why would sea-level rise for global warming and polar ice-melt? By Aftab Alam Khan published in Geoscience Frontiers. Excerpts below with my bolds. H/T to NoTricksZone. ONLY 0.8% Of Coastal Tide Gauges Show Sea Level Rise On Track To Reach IPCC Year 2100 Projection!
Accurately measuring the sea level with a satellite is highly complex and fraught with uncertainty.
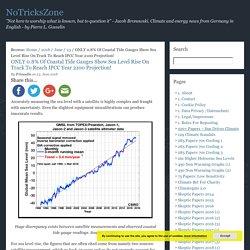
Even the slightest equipment miscalibrations can produce inaccurate results. Huge discrepancy exists between satellite measurements and observed coastal tide gauge readings. Source: CSIRO. For sea level rise, the figures that are often cited come from namely two sources: satellite measurement, which go back 25 years and so do not properly account for multidecadal variations, and tide gauges placed along the coastlines where people actually live. 30 years of NOAA tide gauge data debunk 1988 Senate hearing climate alarmist claims. Guest essay by Larry Hamlin NOAA has updated its coastal tide gauge measurement data through year 2018 with this update now providing 30 years of actual data since the infamous 1988 Senate hearings that launched the U.S. climate alarmist political propaganda campaign.

In June of 1988 testimony was provided before Congress by various scientists, including NASA’s Dr. James Hansen, claiming that man made greenhouse gas emissions were responsible for increasing global temperatures with the New York Times reporting, “Global Warming Has Begun, Experts Tells Senate”. The Times article noted that “The rise in global temperature is predicted to cause a thermal expansion of the oceans and to melt glaciers and polar ice, thus causing sea levels to rise by one to four feet by the middle of the next century. Scientists have already detected a slight rise in sea levels.” NOAA has updated its extensive U.S. coastal tide gauge data measurement records to include data through year 2018. Dr. Roy Spencer on the sea level spat between Gavin and Willis. Sea Level Speculation Irresponsibly Threatens Property Owners.
By Jim Steele Director emeritus Sierra Nevada Field Campus, San Francisco State University and author of Landscapes & Cycles: An Environmentalist’s Journey to Climate Skepticism Pacifica California, just south of San Francisco, is my adopted hometown of 25 years.

Five or More Failed Experiments in Measuring Global Sea Level Change. Willie Soon, Ph.D. What’s Natural? Changing Sea Levels – Part 1. New Scare Science: Global Sea Levels Rose A Staggering 3.1 Inches (1.42 mm/yr) During 1958-2014. Antarctica & Greenland Combined Added 0.59 Of An Inch To Sea Levels Since 1958 Graph Source: Grinsted et al., 2009 In a newly published paper, oceanographers estimate that global sea levels rose at a rate of ~1.42 mm per year−1 (1.32 to 1.52 mm/yr−1) between 1958 and 2014, a 56-year span that directly coincides with an unprecedented rise in anthropogenic CO2 emissions.
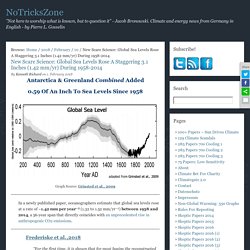
Frederiske et al.,2018 “For the first time, it is shown that for most basins the reconstructed sea level trend and acceleration can be explained by the sum of contributors, as well as a large part of the decadal variability. This rate (which scores between the estimated sum of sea level rise contributors and a reconstruction from tide gauge and satellite measurements) is similar to the reconstructed rate for 1954-2003 (1.45 mm/yr−1) estimated by Dr. Holgate, 2007. Inconvenient: NASA shows global sea level…pausing, instead of rising. This is interesting. It appears that a “pause” has developed in global sea levels. For two years, since July 2015, there has been no sustained increase in global sea level, in fact, it appears to have actually fallen a bit.
This graph, provided by NASA’s Global Climate Change website, tells the story: A zoom of the area of interest, two years prior to the most recent data point. Sea Levels are Never Still. By Viv Forbes, Rosewood Qld Australia Sea levels have been rising and falling without any help from humans for as long as Earth’s oceans have existed. The fastest and most alarming sea changes to affect mankind occurred at the end of the Pleistocene Ice Age. Seas rose about 130m about 12,000 years ago, at times rising at five metres per century.
2 New Papers: Temperatures, Sea Levels, Climate Dynamics ‘Have No Apparent Relationship To Atmospheric CO2’ Image Source: Robertson and Chilingar, 2017 According to the most basic precepts of anthropogenic global warming (AGW), variations in CO2 concentrations exert significant control on sea surface temperatures, glaciers, sea levels, and generalized climate dynamics (i.e., precipitation patterns). In particular, high CO2 concentrations, driven by human activity, are presumed to cause dangerously warming ocean waters, rapid glacier melt and sea level rise, and overall disruption to the Earth’s biosphere. Newly published scientific papers wholly undermine this popularized conceptualization. In fact, according to Bertrand et al. (2017), there has been a “marked cooling” of sea surface temperatures in the southernmost South America region during the last ~800 years — 3°C to 4°C colder than during the Medieval and Roman warm periods — that has continued unabated into “the most recent decades”.
Bertrand et al., 2017. 3 New Papers: Global Seas Rising About 2 Inches Per Century. NOAA — Straight Talk on Sea Level Rise. Sea Level Rise, Acceleration, and Closure. Acclimatise Climate Change Adaptation Consultants - Welcome to the Acclimatise Network - Climate change adaptation news for businesses and governments. By Luke Jackson, University of Oxford “Sea-level rise” is a loaded statement and instils concern, scepticism and humour. UK Climate Change Risk Assessment 2017. New Paper: Lower Arctic Sea Level Rise Estimated At Only 1.5 Millimeters Per Year! By P Gosselin on 14. NASA Hiding The Decline In Sea Level And Temperature. In 1963, The Guardian reported that since 1940 global temperatures were declining, sea level rise was slowing, and glaciers were growing. 1988 Congressional climate change hearing: claims of accelerating sea level rise – failed. Guest essay by Larry Hamlin On June 23, 1988 the Senate Committee on Energy and Natural Resources held a hearing addressing the Greenhouse Effect and Global Climate Change.
Among the presenters at this hearing was Dr. James Hansen, Director, NASA Goddard Institute for Space Studies who introduced his infamous and now debunked global surface temperature model results with future temperature projections under three different scenarios of CO2 emissions growth that grossly over exaggerated resulting projected global temperature increases. Also testifying at the hearing was Dr. Michael Oppenheimer, senior scientist with the Environmental Defense Fund who presented claims that included projections of future sea level rise acceleration that would occur in the coming decades.
Uneven rates of sea level rise tied to climate change. From Eurekalert Public Release: 3-Dec-2018.