
Social Science Statistics Blog: Chernoff Faces. « The cognitive style of better powerpoint | Main | Business Information and Social Science Statistics » 10 November 2006 Chernoff Faces We haven't had much on graphics on this blog yet, partly because there are several specialized fora for this peculiar aspect of statistics: for instance, junkcharts, the R-gallery, information aesthetics, the Statistical Graphics and Data Visualization blog, the Data Mining blog, Edward Tufte's forum, Andrew Gelman's blog and others.
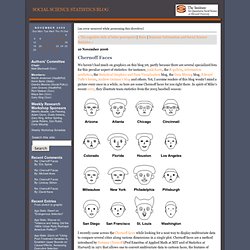
Yet, I assume readers of this blog wouln't mind a picture every once in a while, so here are some Chernoff faces for you right there. In spirit of Mike's recent entry, they illustrate team statistics from the 2005 baseball season: I recently came across the Chernoff faces while looking for a neat way to display multivariate data to compare several cities along various dimensions in a single plot. The key idea is that human are well trained to recognize faces and discern small changes without difficulty. Manifold Learning. Lecture #1: Introduction to linear and non-linear dimensionality reduction.
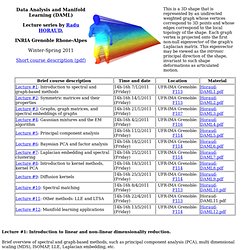
Brief overview of spectral and graph-based methods, such as principal component analysis (PCA), multi dimensional scaling (MDS), ISOMAP, LLE, Laplacian embedding, etc. Further readings: L. Saul et al. Spectral Methods for Dimensionality Reduction. O. Lecture #2: Properties of symmetric matrices. Eigenvalues and eigenvectors. Lecture #3: Graphs, graph matrices and spectral embeddings of graphs. What is the matrix of a graph? Lecture #4: The Gaussian distribution, Gaussian mixtures, and the EM algorithm. The univariate and multivariate Gaussian distributions.
R Commander. John Fox and Milan Bouchet-Valat Please Read the Rcmdr Installation Notes (click on the image for a larger view) For more details, see my paper on the R Commander in the Journal of Statistical Software (which is somewhat out of date) and the introductory manual distributed with the package (accessible via the Help -> Introduction to the R Commander menu).
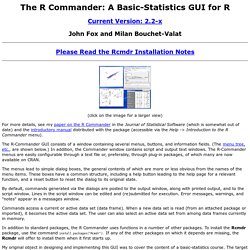
The R-Commander GUI consists of a window containing several menus, buttons, and information fields. (The menu tree, etc., are shown below.) The menus lead to simple dialog boxes, the general contents of which are more or less obvious from the names of the menu items. By default, commands generated via the dialogs are posted to the output window, along with printed output, and to the script window. Commands access a current or active data set (data frame).
In addition to standard packages, the R Commander uses functions in a number of other packages. I'm making the GUI available as the Rcmdr package. Philip Ball: Books, Biography, Blog, Audiobooks, Kindle. Credit Scoring, Data Mining, Predictive Analytics, Statistics, StatSoft Electronic Textbook. "Thank you and thank you again for providing a complete, well-structured, and easy-to-understand online resource.

Every other website or snobbish research paper has not deigned to explain things in words consisting of less than four syllables. I was tossed to and fro like a man holding on to a frail plank that he calls his determination until I came across your electronic textbook...You have cleared the air for me. You have enlightened. You have illuminated. You have educated me. " — Mr. "As a professional medical statistician of some 40 years standing, I can unreservedly recommend this textbook as a resource for self-education, teaching and on-the-fly illustration of specific statistical methodology in one-to-one statistical consulting.
. — Mr. "Excellent book. . — Dr. "Just wanted to congratulate whoever wrote the 'Experimental Design' page. . — James A. Read More Testimonials >> Make the Best Decisions. Beautiful math in all browsers.