
Advanced R. YouTube. Top Data Science Project - Sentiment Analysis Project in R. Today, we are starting our series of R projects and the first one is Sentiment analysis.
So, in this article, we will develop our very own project of sentiment analysis using R. We will make use of the tiny text package to analyze the data and provide scores to the corresponding words that are present in the dataset. In the end, you will become industry ready to solve any problem related to R programming. Before we start, you must take a quick revision to R concepts. R Project – Sentiment Analysis The aim of this project is to build a sentiment analysis model which will allow us to categorize words based on their sentiments, that is whether they are positive, negative and also the magnitude of it. What is Sentiment Analysis? Sentiment Analysis is a process of extracting opinions that have different polarities.
R para principiantes. R tiene sus orígenes en S, un lenguaje de programación creado en los Laboratorios Bell de Estados Unidos.
Sí, los mismos laboratorios que inventaron el transistor, el láser, el sistema operativo Unix y algunas otras cosas más. Dado que S y sus estándares son propiedad de los Laboratorios Bell, lo cual restringe su uso, Ross Ihaka y Robert Gentleman, de la Universidad de Auckland en Nueva Zelanda, decidieron crear una implementación abierta y gratuita de S. My favourite alternative to Excel dashboards. Excel dashboards are great… what?
😯 For all the complaints that people have for Excel, it still has many clear, indisputable advantages. For one, it is extremely accessible – almost everyone has Excel installed on their computer. It’s familiar to most people, and practically anyone who can use a computer will know how to perform basic operations like doing a SUM function or filter a column.
In the context of sharing analysis or findings, Excel more importantly has portability. You can send stand-alone Excel files over email, share them with colleagues/clients over SharePointYou can open Excel files without internet if you’re stuck in a rainforest or the London Underground (!) Moreover, Excel files are also virtually free to create, as realistically you don’t need to take out any additional licenses in order to create/host a dashboard in Excel, unlike Tableau or Power BI where there is at least some cost for a practical commercial deployment. Advantages of Excel What is a dashboard? Two Styles of Learning R. What’s the best way to learn R?
Motivations behind the debate Some argue that R fundamentally has a steep learning curve, and that there are no real shortcuts for learning R. I don’t completely agree with that: I think that there are easier ways to learn R nowadays, specifically with the availability and expansion of the tidyverse collection of packages. Cheatsheet - 11 Steps for Data Exploration in R (with codes) A Guide to Analyzing (American) Political Data in R. Written by Ari Lamstein and Logan Powell. Written by Ari Lamstein and Logan Powell The U.S.
Census Bureau is the premier source of data about America’s people, places and economy. This makes the Bureau a natural source of information for data analysts. Home · Rdatatable/data.table Wiki. Writing an R package from scratch. Writing an R package from scratch. Anyone who has created their own R package has probably come across Hilary Parker’s awesome blogpost, that walks you through creating your very first R package.
The comprehensive detail on everything R packages can be found in Hadley Wickham’s superb book. In this post I am going to walk through some of the developments in the package development space since Hilary wrote her blog four years ago, in particular focussing on the relatively recent usethis package. I’ve made the assumption for this following tutorial that you’re a sane individual and that you’re using the RStudio IDE. My main motivation stemmed from Hadley’s tweet: The package I have created during the course of this blog can be found on my GitHub. Initial Setup Within this section we will assemble the bare bones of a package and is very similar to Hilary’s blog I linked to earlier. Step 0: Packages we need The three packages we require are devtools, roxygen2 and usethis. Step 1: Creating the package. Welcome · R packages. Hadley Wickham. Political analysis in r. Translated Syntax, Curriculum, Quantitative Analysis Center.
Understanding Syntax The Passion Driven Statistics curriculum is intended to help students perform basic data management and statistical tests across 4 major statistical software platforms (R, SAS, Stata and SPSS).
This web page provides a library of basic commands that the user can copy and paste into R, SAS, Stata or SPSS to perform a variety data management tasks and basic statistical tests. Our goal is to help student’s use statistical computing as a building block in scientific reasoning and creativity. Rather than producing students who can think about statistics from a software-specific perspective, these resources are meant to help students move flexibly and confidently between statistical software environments.
It is important to note that we use the following convention when presenting software-specific syntax. R Consortium. Learn R : 12 Free Books and Online Resources – YOU CANalytics. Please read the disclaimer about the Free PDF Books in this article at the bottom R, an open-source statistical and data mining programming language, is slowly but surely catching up in its race with commercial software like SAS & SPSS.
I believe R will eventually replace SAS as the language of choice for modeling and analysis for most organizations. The primary reason for this is plainly commercial. Most organizations are questioning the heavy annual cost of SAS on their P&L statement. This is escalated with the presence of R as a free and viable replacement. Human Obsession with Linearity – by Roopam Non-Linear Self-Learning Humans are obsessed with linearity.
R for Data Science. R Markdown. Bookdown: Easy Book Publishing with R Markdown. R Commander. John Fox and Milan Bouchet-Valat Please Read the Rcmdr Installation Notes (click on the image for a larger view) For more details, see my paper on the R Commander in the Journal of Statistical Software (which is somewhat out of date) and the introductory manual distributed with the package (accessible via the Help -> Introduction to the R Commander menu).
The R-Commander GUI consists of a window containing several menus, buttons, and information fields. (The menu tree, etc., are shown below.) The menus lead to simple dialog boxes, the general contents of which are more or less obvious from the names of the menu items. By default, commands generated via the dialogs are posted to the output window, along with printed output, and to the script window.
R Moves Up From #9 to #6, But What Does It Mean to Really be Proficient in a Language? There's been a lot of noise in the data science community this past week about IEEE Spectrum's 2015 language rankings, where R moved up three notches from #9 in 2014 to #6 in 2015.
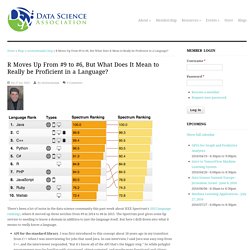
The Spectrum post gives some lip service to needing to know a domain in addition to just the language itself. But here I drill down into what it means to really know a language. API for the standard library. · R Tools for Visual Studio. Welcome to R Tools for Visual Studio Preview! About this release THANK YOU for trying out this second preview release of R Tools for Visual Studio (RTVS)! We welcome your feedback and comments; we’re actively monitoring our Github issue tracker and triage new incoming issues every Friday. Of course, we remind you that this release is meant for evaluation purposes only and not for production use. Cookbook for R. Code School. Free Introduction to R Programming Online Course. Tutorials - useR! 2013. Inicio. LIBROS RECOMENDADOS PARA APRENDER ESTADÍSTICA CON R - Blog Estadística & R.
Hoy vengo con una lista de libros recomendados para leer en cualquier momento de tu carrera profesional porque son algunos de los mejores y más leídos libros de Estadística con R. Todos los libros que te enseño son excelentes, no hay un orden de importancia, pero sí hay diferencias en la complejidad de cada uno. Voy a comentarte cada libro para que sepas si está hecho para ti. La lista la iré actualizando según lea otros libros destacados que me parezcan imprescindibles. Es un curso de Estadística básica con R que logra su objective, es rápido y una buena referencia para comenzar. Utiliza mucho ejemplos para su desarrollo y puedes descargarte un paquete que contiene todos los datos.
16 courses to learn R in 2016 - Master Data Analysis.