
Statistics made easy ! ! ! Learn about the t-test, the chi square test, the p value and more. P-values, and when not to use them. If you look at published research papers in fields involving data analysis (which nowadays is basically every field), you’ll often see a little asterisk* next to the numbers with a footnote saying “statistically significant”.
Statistical significance is essentially a check that we can do to verify that our results aren’t due to chance, and they involve computing something called a p-value (probability value). And while the statistical significance asterisk is often interpreted as a stamp of approval for the validity of the research, there are some issues we can run into using p-values blindly. But before I explain what a p-value is and what the problems associated with them are, it’s important to understand the general framework that these kinds of studies use — hypothesis testing. The hypothesis testing framework involves comparing a “null hypothesis” to an “alternate hypothesis”. Typically, the null is the status quo, and the alternate is your hypothesis — the one you want to test.
What a p-Value Tells You about Statistical Data. By Deborah J.
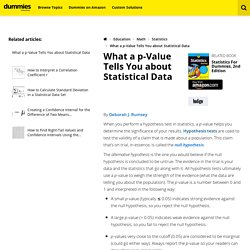
Rumsey When you perform a hypothesis test in statistics, a p-value helps you determine the significance of your results. Hypothesis tests are used to test the validity of a claim that is made about a population. This claim that’s on trial, in essence, is called the null hypothesis. The alternative hypothesis is the one you would believe if the null hypothesis is concluded to be untrue. A small p-value (typically ≤ 0.05) indicates strong evidence against the null hypothesis, so you reject the null hypothesis.A large p-value (> 0.05) indicates weak evidence against the null hypothesis, so you fail to reject the null hypothesis.p-values very close to the cutoff (0.05) are considered to be marginal (could go either way).
SISA allows you to do statistical analysis directly on the Internet. 17 Differences between Validity and Reliability - Public Health Notes. 1.2 Variables and Measures. Data Levels of Measurement - Statistics Solutions. In descending order of precision, the four different levels of measurement are: Nominal–Latin for name only (Republican, Democrat, Green, Libertarian)Ordinal–Think ordered levels or ranks (small–8oz, medium–12oz, large–32oz)Interval–Equal intervals among levels (1 dollar to 2 dollars is the same interval as 88 dollars to 89 dollars)Ratio–Let the “o” in ratio remind you of a zero in the scale (Day 0, day 1, day 2, day 3, …) The first level of measurement is nominal level of measurement.
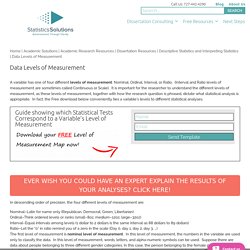
In this level of measurement, the numbers in the variable are used only to classify the data. In this level of measurement, words, letters, and alpha-numeric symbols can be used. Suppose there are data about people belonging to three different gender categories. The second level of measurement is the ordinal level of measurement. : Tutorials, Calculators, Consulting and Statistics Help. Data analysis. Stats & SPSS resources. Statistics Definitions in Plain English with Examples - Statistics How To. Confused about a term in statistics?
Check out our explanations for statistical terms. Statistics definitions in simple English! Many of the statistics definitions you’ll find here include videos, graphs and charts to make the explanations easier to understand. Finding What You Need I have listed the most popular articles here. Table of Contents. Scientific method: Statistical errors. For a brief moment in 2010, Matt Motyl was on the brink of scientific glory: he had discovered that extremists quite literally see the world in black and white.

The results were “plain as day”, recalls Motyl, a psychology PhD student at the University of Virginia in Charlottesville. Data from a study of nearly 2,000 people seemed to show that political moderates saw shades of grey more accurately than did either left-wing or right-wing extremists. “The hypothesis was sexy,” he says, “and the data provided clear support.”
The P value, a common index for the strength of evidence, was 0.01 — usually interpreted as 'very significant'. Convenience sampling - Research Methodology. Convenience sampling (also known as availability sampling) is a specific type of non-probability sampling method that relies on data collection from population members who are conveniently available to participate in study.
Facebook polls or questions can be mentioned as a popular example for convenience sampling. Convenience sampling is a type of sampling where the first available primary data source will be used for the research without additional requirements. In other words, this sampling method involves getting participants wherever you can find them and typically wherever is convenient.
In convenience sampling no inclusion criteria identified prior to the selection of subjects. All subjects are invited to participate. Choosing the Correct Statistical Test in SAS, Stata, SPSS and R. The following table shows general guidelines for choosing a statistical analysis.
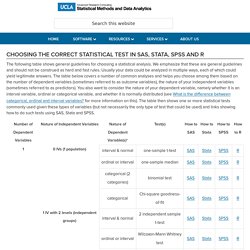
We emphasize that these are general guidelines and should not be construed as hard and fast rules. Usually your data could be analyzed in multiple ways, each of which could yield legitimate answers. The table below covers a number of common analyses and helps you choose among them based on the number of dependent variables (sometimes referred to as outcome variables), the nature of your independent variables (sometimes referred to as predictors). FAQ: What are the differences between one-tailed and two-tailed tests? When you conduct a test of statistical significance, whether it is from a correlation, an ANOVA, a regression or some other kind of test, you are given a p-value somewhere in the output.
If your test statistic is symmetrically distributed, you can select one of three alternative hypotheses. Two of these correspond to one-tailed tests and one corresponds to a two-tailed test. However, the p-value presented is (almost always) for a two-tailed test. But how do you choose which test? Is the p-value appropriate for your test? Has statistics made us healthier? The role of statistics in public health.
Public health – defined as the science and art of prolonging life, preventing disease and preventing disability through the organized efforts of society by the UK Faculty of Public Health – has without a doubt had great success.
Of the ten great public health achievements in the 20th century (see below), many were made possible by knowledge obtained by statistical analysis. For each achievement, the CDC has published thorough and careful essays on the US context. How to interpret ordinal data. The following (slightly modified) question was posted as a comment here, but I felt that the answer was too lengthy for the comments section.

Our questionnaire is composed of items with a 5 point scale, ranging from “1=strongly disagree” to “5=strongly agree”. For example, we are trying to find out if the respondents agree with [a topic]. The number of respondents who ‘strongly disagree’ are 2, those who ‘disagree’ are 9, those who ‘are undecided’ are 24, those who ‘agree’ are 18 and those who ‘strongly agree’ are 7. How do I interpret this data? What a nerdy debate about p-values shows about science — and how to fix it. There’s a huge debate going on in social science right now. The question is simple, and strikes near the heart of all research: What counts as solid evidence? The answer matters because many disciplines are currently in the midst of a “replication crisis” where even textbook studies aren’t holding up against rigorous retesting. The list includes: ego depletion, the idea that willpower is a finite resource; the facial feedback hypothesis, which suggested if we activate muscles used in smiling, we become happier; and many more.
My Market Research Methods - Types of data measurement scales: nominal, ordinal, interval. There are four measurement scales (or types of data): nominal, ordinal, interval and ratio. These are simply ways to categorize different types of variables. This topic is usually discussed in the context of academic teaching and less often in the “real world.” If you are brushing up on this concept for a statistics test, thank a psychologist researcher named Stanley Stevens for coming up with these terms.
These four measurement scales (nominal, ordinal, interval, and ratio) are best understood with example, as you’ll see below. Nominal Let’s start with the easiest one to understand. Principles. Principles of Epidemiology: Home. Book originally published: October 2006 Book updated: November 2011 This course [book] was developed by the Centers for Disease Control and Prevention (CDC) as a self-study course. Continuing Education for this course is no longer available.
Adolescent and School Health. Skip directly to search Skip directly to A to Z list Skip directly to navigation Skip directly to page options Skip directly to site content Get Email Updates To receive email updates about this page, enter your email address: CDCDASH HomeDataYRBSSData & Documentation YRBSS Data & Documentation Recommend on Facebook Tweet On This Page. Statistics. Statistics is the study of the collection, organization, analysis, interpretation and presentation of data. Statistics looks at all aspects of data. Statistics is mostly application based due to its numerical roots. Web-based Sample Size/Power Calculations. AP Statistics Multiple Choice Practice. Help Online - Origin Help - Nonparametric Tests (Pro Only) Help Online - Origin Help - Interpreting Results of Discriminant Analysis. DiscAnalysis-Result Discriminant Report Sheet. Outcome Factors. Dealing with Non-normal Data: Strategies and Tools. Negative Correlation in Psychology: Examples, Definition & Interpretation - Video & Lesson Transcript.
Chi-square test in SPSS + interpretation. Fisher's Exact Test in SPSS. Yates Correction - Explained (but don't ever use it) Australian Statistical Geography Standard (ASGS) The Australian Statistical Geography Standard (ASGS) provides a framework of statistical areas used by the Australian Bureau of Statistics (ABS) and other organisations to enable the publication of statistics that are comparable and spatially integrated. First introduced in 2011, the ASGS replaced the Australian Standard Geographical Classification (ASGC) that had been in use since 1984. The ASGS provides users with an integrated set of standard areas that they can use to access, visualise, analyse and understand statistics produced by the ABS and other organisations.
The ASGS is split into two parts, the ABS Structures and the Non ABS Structures. The ABS Structures are areas that the ABS designs specifically for outputting statistics. This means that the statistical areas are designed to meet the requirements of specific statistical collections as well as geographic concepts relevant to those statistics such as remoteness and urban/rural definitions. Statistics Formulas.
This web page presents statistics formulas described in the Stat Trek tutorials. MedCalc statistical software. MA121 6.3. Jcn 9 381. IBM Knowledge Center - One-Way ANOVA Post Hoc Tests. United States IBM Knowledge Center Site map Marketplace. Posthoc. Ztable. Deriving Z-Test Formulas: 1-Sample, 1-Sided. How do I determine whether my data are normal? The Central Limit Theorem. To understand the wildness of samples, we would choose thousands of samples, calculate an x-bar for each, and display the x-bars in a histogram. This histogram represents a sampling distribution and when we look at it we see something truly amazing.
Sampling distributions tend to be far less variable or wild than the populations they are drawn from (See Fig. 1A, 1B, 1C and 1D.) They also have essentially the same mean as the population. Sampling Distribution. VassarStats: Statistical Computation Web Site. Menu. OpenEpi provides statistics for counts and measurements in descriptive and analytic studies, stratified analysis with exact confidence limits, matched pair and person-time analysis, sample size and power calculations, random numbers, sensitivity, specificity and other evaluation statistics, R x C tables, chi-square for dose-response, and links to other useful sites. Explaining Odds Ratios. National Statistical Service § Sample Size Calculator. Sample Size Calculator - Confidence Level, Confidence Interval, Sample Size, Population Size, Relevant Population - Creative Research Systems.
This Sample Size Calculator is presented as a public service of Creative Research Systems survey software. You can use it to determine how many people you need to interview in order to get results that reflect the target population as precisely as needed. Sample Size Calculator by Raosoft, Inc. THE DECISION TREE FOR STATISTICS. Factor Analysis - Statistics Solutions. Measuring Association in Case-Control Studies. SPSS Data files and exercises. Gapminder: Unveiling the beauty of statistics for a fact based world view. Businessinsider.
Online Statistics Education: A Free Resource for Introductory Statistics. What is the difference between categorical, ordinal and interval variables? Difference Between Linear and Logistic Regression: Linear Regression vs Logistic Regression. Mann-Whitney U Test in SPSS Statistics. The Distribution of Independent Variables in Regression Models. A comparison of the Pearson and Spearman correlation methods - Minitab Express.
Cohen's d. Introduction to Real World Statistics: With Step-By-Step SPSS Instructions (Paperback) Procedure, output and interpretation of the output using a relevant example. Incidence and Prevalence. RStata. Data Analysis and Statistical Software. To make science better, watch out for statistical flaws. 2011 Census data. Census TableBuilder - Log in.
Big Data, Data Mining, Predictive Analytics, Statistics, StatSoft Electronic Textbook.