
Angular Dimple. Emeeks/d3-carto-map · GitHub. d3.keybinding. Interactive Map with d3.js - TNODA. This is an interactive map.
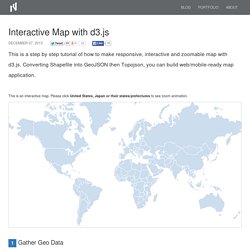
Please click United States, Japan or their states/prefectures to see zoom animation. 1 Gather Geo Data d3.js doesn't come with geo data, so let's get country, state/province and city data first. Natural Earth is one of the best sources for Earth data. When you go to the download page, there are three data scales: 1:10m, 1:50m and 1:110m. 1:10m has the most detailed data but is the largest file size, which is not usually suitable for web application data. 2 Shapefile GeoJSON Topojson Once you download and unzip them, you can find a bunch of files with different file extensions. Install GDAL To convert a shapefile into GeoJSON, we'll use a command line tool, ogr2ogr in Geospatial Data Abstraction Library - GDAL.
> brew install gdal Install Topojson Another CLI tool that we use will use is topojson, which converts GeoJSON to Topojson. > npm install -g topojson 3 Convert Files Let's start with the countries shapefile. Exclude Antarctica Pick attributes 4 Simplify Files. D3 World Map with Natural Earth Clipped Tiles. Jason Davies - Freelance Data Visualisation.
Automatic Projection Tiles. What are Tiles?
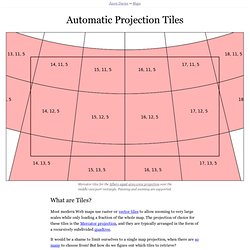
Most modern Web maps use raster or vector tiles to allow zooming to very large scales while only loading a fraction of the whole map. The projection of choice for these tiles is the Mercator projection, and they are typically arranged in the form of a recursively subdivided quadtree. It would be a shame to limit ourselves to a single map projection, when there are so many to choose from! But how do we figure out which tiles to retrieve? How it Works My initial attempts involved inverting the viewport polygon to figure out which tiles overlap with it. Mike Bostock then pointed out that the tiles can be traversed recursively (in logarithmic time, since it’s a tree), using a custom geometry stream to detect if a tile is visible or not.
Starting with a single large tile covering most of the globe, this recursively rejects large swathes of the quadtree, and is very fast even at a zoom level of 18! Www.web-maps.com/D3NasaNeo/ Map Projection Transitions. Satellite Raster. Raster Reprojection. Jquery - How do I get my D3 map to zoom to a location. Simple Map D3. All you need is a dataset.
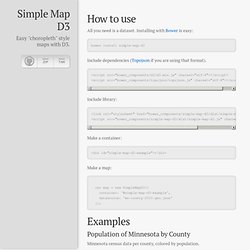
Installing with Bower is easy: bower install simple-map-d3 Include dependencies (Topojson if you are using that format). Include library: Make a container: Make a map: Population of Minnesota by County Minnesota census data per county, colored by population. Europe Population Density Map A simple map of European countries and their population density using a different projection, a slight rotation, custom color set, ability to pan, and a custom tooltip output.
Basic US Map A simple map of US counties using a Topojson data source with some custom styling. World Map A simple map of 2005 world population with graticule and globe turned on and started "manually". Simple Map supports any latitude and longitude (EPSG:4326) based GeoJSON or TopoJSON file. HTML: Make it simple - example of leaflets built-in Simplification - Polyline_smoothFactor. D3: TopoJSON: Animated demonstration on polygon aggregation I. Mbostock.github.io/d3/talk/20111018/tree.html. Zensus 2011 Atlas. Zoom to Bounding Box. Click-to-zoom via transform. D3.js - Data-Driven Documents. Manipulating data like a boss with d3. Mike Bostock. December 27, 2014Mapping Every Path to the N.F.L.

Playoffs December 20, 2014How Each Team Can Make the N.F.L. Playoffs November 5, 2014The Most Detailed Maps You’ll See From the Midterm Elections November 3, 2014How To Scroll September 19, 2014‘Stop-and-Frisk’ Is All but Gone From New York July 26, 2014Mapping the Spread of Drought Across the U.S. June 26, 2014Visualizing Algorithms June 15, 2014Three Little Circles May 22, 2014Is It Better to Rent or Buy? May 6, 2014Let’s Make a Bubble Map April 22, 2014Who Will Win The Senate? March 7, 2014Let’s Make a Block Feburary 14, 2014Front Row to Fashion Week February 14, 2014Sochi 2014: Interactive Stories January 11, 2014Taking the Battle to the States November 30, 2013Tracing the History of N.C.A.A.
November 5, 2013Let’s Make a Bar Chart, Parts 1-3 October 27, 2013A Game of Shark and Minnow October 14, 2013The Russia Left Behind September 29, 2013For Eli Manning, 150 Games and Counting September 25, 2013Oracle’s Path to Victory June 9, 2013For Example #Talks. d3/lib/colorbrewer at master · mbostock/d3.