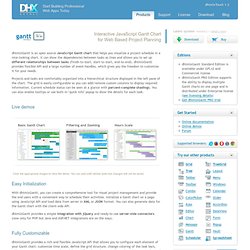

Gantt - Editable JavaScript DHTML Gantt Chart with Rich API. DhtmlxGantt is an open source JavaScript Gantt chart that helps you visualize a project schedule in a nice-looking chart.

It can show the dependencies between tasks as lines and allows you to set up different relationships between tasks (finish-to-start, start-to-start, end-to-end). dhtmlxGantt provides flexible API and a large number of event handles, which gives you the freedom to customize it for your needs. Projects and tasks are comfortably organized into a hierarchical structure displayed in the left pane of the chart. The grid is easily configurable so you can add/remove custom columns to display required information. Current schedule status can be seen at a glance with percent-complete shadings. You can also enable tooltips or use built-in "quick info" popup to show the details for each task. Interactive Data Visualization for the Web Create and publish your own interactive data visualization projects on the Web—even if you have little or no experience with data visualization or web development.

It’s easy and fun with this practical, hands-on introduction. Author Scott Murray teaches you the fundamental concepts and methods of D3, a JavaScript library that lets you express data visually in a web browser. Along the way, you’ll expand your web programming skills, using tools such as HTML and JavaScript. This step-by-step guide is ideal whether you’re a designer or visual artist with no programming experience, a reporter exploring the new frontier of data journalism, or anyone who wants to visualize and share data. D3.js Tutorials, Screencasts and a Newsletter.