
D3 and React - the future of charting components? - Binary Consulting. Data-Driven Documents (D3.js) is currently my favoured charting library for producing interactive SVG visualisations.
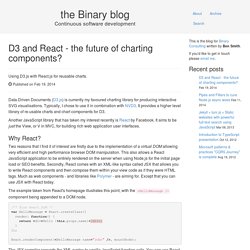
Typically, I chose to use it in combination with NVD3. It provides a higher level library of re-usable charts and chart components for D3. Another JavaScript library that has taken my interest recently is React by Facebook. It aims to be just the View, or V in MVC, for building rich web application user interfaces. Why React? Sarah Mei » Why You Should Never Use MongoDB. Disclaimer: I do not build database engines.
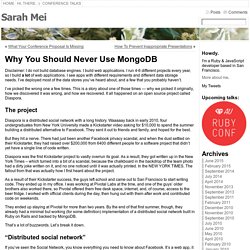
I build web applications. I run 4-6 different projects every year, so I build a lot of web applications. I see apps with different requirements and different data storage needs. Cut Two Pieces: Inkscape. Do you use Inkscape?
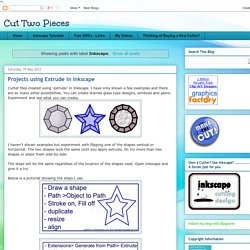
Did you know there is a built in feature to create calendars? If you don’t have Inkscape but would like to make a calendar go here and download the program (it is free). Gephi - The Open Graph Viz Platform. Www.jeromecukier.net/wp-content/uploads/2012/10/d3-cheat-sheet.pdf. Www.jeromecukier.net/wp-content/uploads/2012/10/d3-cheat-sheet.pdf. How Selections Work. Any sufficiently advanced technology is indistinguishable from magic.
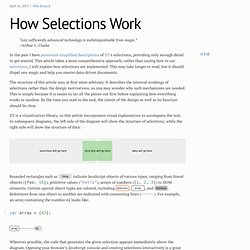
–Arthur C. Clarke In the past I have presented simplified descriptions of D3’s selections, providing only enough detail to get started. This article takes a more comprehensive approach; rather than saying how to use selections, I will explain how selections are implemented. This may take longer to read, but it should dispel any magic and help you master data-driven documents. The structure of this article may at first seem arbitrary. D3 is a visualization library, so this article incorporates visual explanations to accompany the text. Var array = [42]; Wherever possible, the code that generates the given selection appears immediately above the diagram. Hierarchy for D3.js.
Tutorials. Getting Started with D3: Safari Books Online. Learning D3 Part 1: Selections, Properties, Data. Update: I’m releasing a series of screencast tutorials on D3 at deveo.tv.
Check it out and let me know what you think! I thought I’d take a stab at learning D3, the JavaScript data visualization library. LondonJS: 11 Things You Didn't Know About D3' LondonJS, 21/10/13 I'm a freelance web developer Anna Powell-Smith 11 THINGS I DIDN"T KNOW ABOUT d3... ...until I sat down and read the entire API docs.

D3.js Playground. Sorting a selection in d3.js disturbs the data-join. API Reference · mbostock/d3 Wiki.
Chained Transitions. Selections. Arrays. Interactive Data Visualization for the Web. Contrary to what the name implies, D3 layouts do not, in fact, lay anything out for you on the screen.
The layout methods have no direct visual output. Rather, D3 layouts take data that you provide and remap or otherwise transform it, thereby generating new data that is more convenient for a specific visual task. It’s still up to you to take that new data and generate visuals from it. Here is a complete list of all D3 layouts: Bundle Chord Cluster Force Histogram Pack Partition Pie Stack Tree Treemap In this chapter, I introduce three of the most common: pie, stack, and force. If you are curious about any of the other D3 layouts, check out the many examples on the D3 website, and be sure to reference the official API documentation on layouts. Www.manning.com/meeks/D3js_MEAP_CH01.pdf. D3.
Stacked Bar. Animations and transitions. That post originally appeared on visual.ly, I’m reproducing it here for clarity and ease of retrieval In interactive visualisation, there is the word reactive.
Well, maybe not literally, but close enough. The fact is that reactivity, or the propension of a visualisation to respond to user actions, can really help engage the user in a visualisation, and help them understand its results. Both of which are usually good things. And how can this reactivity be achieved? Path Tween. Smooth Slider. D3, Conceptually - Lesson 0: Preface. If you don't know what D3 is, the short answer is "a Javascript library people use to make cool charts".
The long answer is, as expected, much longer. This tutorial hopes to bridge some of that distance. It is a work-in-progress. D3 is a powerful tool, but you know how that saying goes: "With great power comes a conceptually clean library with a learning curve like a wall". d3: scales, and color. In protovis, scales were super-useful in just about everything.
That much hasn’t changed in d3, even though d3.scale is a bit different from pv.Scale. (do note that d3.scale is in lowercase for starters). Scales: the main idea Simply put: scales transform a number in a certain interval (called the domain) into a number in another interval (called the range). For instance, let’s suppose you know your data is always over 20 and always below 80. But what if you suddenly have more or less space? This is much simpler, elegant, and easy to maintain. . … only more legible and shorter. Fun with scales. El Patrón de los Números Primos: Prime Number Patterns.
By Jason Davies. For each natural number n, we draw a periodic curve starting from the origin, intersecting the x-axis at n and its multiples. The prime numbers are those that have been intersected by only two curves: the prime number itself and one. Below the currently highlighted number, we also show its sum of divisors σ(n), and its aliquot sum s(n) = σ(n) - n, which indicate whether the number is prime, deficient, perfect or abundant.
Based on Sobre el patrón de los números primos by Omar E. Brush Handles. Orthographic Shading. Lab and HCL Color Spaces. D3 supports CIELAB (Lab) and CIELCH (HCL) color spaces, which are designed for humans rather than computers. Lab and HCL color spaces are special in that the perceived difference between two colors is proportional to their Euclidean distance in color space. This special property, called perceptual uniformity, makes them ideal for accurate visual encoding of data. In contrast, the more familiar RGB and HSL color spaces distort data when used for visualization. Vis.