
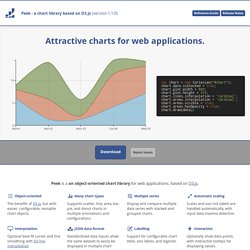
Peek - a chart library based on D3.js. The best way to get an overview is to look at the examples.
Class list User classes are accessed directy. Internal classes are only accessed indirectly, as a child members of a user class. Getting Started - Learn JS Data. This code is using d3.js We use a little arrow, =>, to indicate output from a code snippet.
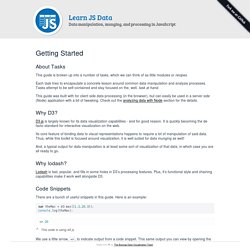
This same output you can view by opening the console of your favorite web browser. Snippets in this guide that are not pure JavaScript will be marked with the libraries used to make them work. D3 on AngularJS. D3, the javascript library for manipulating document-based data is insanely expressive and helps bring data to life through HTML, SVG, and CSS.
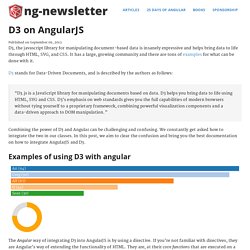
It has a large, growing community and there are tons of examples for what can be done with it. D3 stands for Data-Driven Documents, and is described by the authors as follows: “D3.js is a JavaScript library for manipulating documents based on data. D3 helps you bring data to life using HTML, SVG and CSS. D3’s emphasis on web standards gives you the full capabilities of modern browsers without tying yourself to a proprietary framework, combining powerful visualization components and a data-driven approach to DOM manipulation.” Combining the power of D3 and Angular can be challenging and confusing. Chartist - Simple responsive charts. You may think that this is just yet an other charting library.
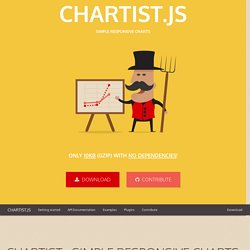
But Chartist.js is the product of a community that was disappointed about the abilities provided by other charting libraries. Of course there are hundreds of other great charting libraries but after using them there were always tweaks you would have wished for that were not included. Highly customizable responsive charts Facts about Chartist The following facts should give you an overview why to choose Chartists as your front-end chart generator: Simple handling while using convention over configurationGreat flexibility while using clear separation of concerns (Style with CSS & control with JS)Usage of SVG (Yes! d4 Examples. d3/d3-plugins. From CSV to HTML table (Advanced) DataMaps. Generate D3 Bar Chart Source Code - D3.js Visualization Creator. d3noob (d3noob) Let’s Make a Block. This is a quick guide on how to post examples to bl.ocks.org.
This is not the only way to do it — you can use GitHub’s Gist editor, for example. But I find this approach convenient because it allows you to preview locally and publish with Git, without leaving the terminal. #Setup Most of this guide takes place in the Mac OS X Terminal. If you don’t already have the Terminal in your dock, you can find it in the Applications > Utilities folder. Do you have Node installed already? Brew install node You’ll also need http-server, a simple zero-configuration web server built on Node for serving content out of the local file system: npm install -g http-server If this is your first time using Node, you may also need to edit your PATH so that you can run programs installed by NPM, Node’s package manager.
Subl /etc/paths If you don’t already have the subl alias for launching Sublime Text from the terminal, create one like so: Now edit the contents of the file so they look like this: #Develop <! Basic Data Types and Interfaces – SVG 1.1 (Second Edition) Contents 4.1 Syntax The EBNF grammar is as used in the XML specification, with the addition of ~, a case-insensitive literal: characters in the ASCII range (only) are declared to be case-insensitive.
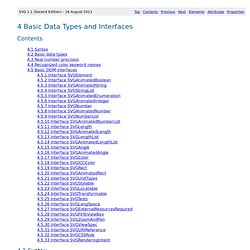
For example, ~"Hello" will match (H|h)(e|e)(l|L)(l|L)(o|O). Leaflet GeoJSON Tile Layer Example. How to Make Choropleth Maps in D3. Even if you think you don’t know what a choropleth map is, chances are you’ve seen one.
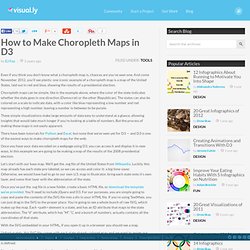
And come November 2012, you’ll see plenty: one iconic example of a choropleth map is a map of the United States, laid out in red and blue, showing the results of a presidential election. Choropleth maps can be simple, like in the example above, where the color of the state indicates whether the state goes in one direction (Democrat) or the other (Republican). The states can also be colored on a scale to indicate data, with a color like blue representing a low number and red representing a high number, leaving a number in between to be purple. These simple visualizations make large amounts of data easy to understand at a glance, allowing insights that would take much longer if you’re looking at a table of numbers. But the process of making these maps is not easily apparent. Once you have your data encoded on a webpage using D3, you can access it and display it in new ways. $('#NY').css('fill', 'red')
Making Dashboards with Dc.js - Part 1: Using Crossfilter.js. Introduction Dc.js is a JavaScript library used to make interactive dashboards in JavaScript.
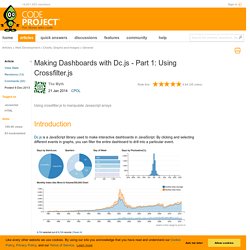
By clicking and selecting different events in graphs, you can filter the entire dashboard to drill into a particular event. This is the first of a 4 part series. Demonstrates D3 transitions and a few svg-replication concepts. Mbostock/us-atlas. Ohio State Plane (N) Tutorials · mbostock/d3 Wiki. Wiki ▸ Tutorials Please feel free to add links to your work!!
Tutorials may not be up-to-date with the latest version 4.0 of D3; consider reading them alongside the latest release notes, the 4.0 summary, and the 4.0 changes. Introductions & Core Concepts Specific Techniques. Home · mbostock/d3 Wiki.
Examples. d3_tutorial/ Intro Data-Driven Documents, or D3 for short, is a new visualization library to build visualizations in SVG.
But in my opinion, it's also the best javascript multipurpose SVG library when it comes to animation, interaction and above all for binding data to graphics. The community is very responsive, source code is very clean and the API is well written. Sortable Table. Sortable Table.