
DataMaps. Interactive Map with d3.js - TNODA. This is an interactive map.
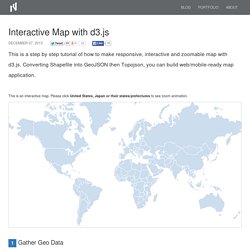
Please click United States, Japan or their states/prefectures to see zoom animation. 1 Gather Geo Data d3.js doesn't come with geo data, so let's get country, state/province and city data first. Natural Earth is one of the best sources for Earth data. When you go to the download page, there are three data scales: 1:10m, 1:50m and 1:110m. 1:10m has the most detailed data but is the largest file size, which is not usually suitable for web application data. 2 Shapefile GeoJSON Topojson Once you download and unzip them, you can find a bunch of files with different file extensions.
Install GDAL To convert a shapefile into GeoJSON, we'll use a command line tool, ogr2ogr in Geospatial Data Abstraction Library - GDAL. > brew install gdal Install Topojson Another CLI tool that we use will use is topojson, which converts GeoJSON to Topojson. > npm install -g topojson 3 Convert Files Let's start with the countries shapefile. Exclude Antarctica Pick attributes 4 Simplify Files. Drawing Maps with D3.js and Other Geographical Fun. WARNING: Heavy CPU Usage ahead I recently decided to create some mapping visualisations.
Mostly because using a map is an awesome way to present many data sets, and creating such visualisation is a skill I lacked. For Example. I am a big fan of examples.
Not a surprise, right? If you follow me on Twitter, or my projects over the last few years (or asked D3 questions on Stack Overflow), you’ve likely seen some of my example visualizations, maps and explanations. I use examples so often that I created bl.ocks.org to make it easier for me to share them. It lets you quickly post code and share examples with a short URL.
Your code is displayed below; it’s view source by default. I initially conceived this talk as an excuse to show all my examples. This talk does have a point, though. #The Flawed Example So let’s start with an example, shall we? Jason Davies and I created this to demonstrate a new feature in D3 3.0’s geographic projection system. One challenge in map projection is that input geometry—coast lines, country borders and such—are defined as polygons. Zoomable D3.js Interactive Map. Building Great Web Maps: A D3.js Tutorial. Data Driven Documents, or D3.js, is “a JavaScript library for manipulating documents based on data”.
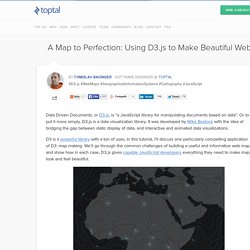
Or to put it more simply, D3.js is a data visualization library. It was developed by Mike Bostock with the idea of bridging the gap between static display of data, and interactive and animated data visualizations. D3 is a powerful library with a ton of uses. In this tutorial, I’ll discuss one particularly compelling application of D3: map making. We’ll go through the common challenges of building a useful and informative web map, and show how in each case, D3.js gives capable JavaScript developers everything they need to make maps look and feel beautiful. What is D3 used for? D3.js can bind any arbitrary data to a Document Object Model (DOM), and then, through the use of JavaScript, CSS, HTML and SVG, apply transformations to the document that are driven by that data.
Rotate the World. Jason Davies → Maps Drag to rotate the world.
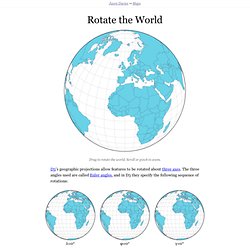
Scroll or pinch to zoom. D3’s geographic projections allow features to be rotated about three axes. The three angles used are called Euler angles, and in D3 they specify the following sequence of rotations: This sequence is convenient, since if we approximate the globe as a sphere, the first two angles can be used to specify a central meridian λ0 and central meridian φ0 by simple negation: [-λ0, -φ0], and the third angle allows oblique projections.
Interactive Rotations A naïve implementation simply takes the x- and y-coordinates in 2D screen space and uses them directly as the first two Euler angles mentioned above. However, the geographic start point of the gesture often moves at a different speed to the cursor, making it difficult to control. Naïve implementation (left) and improved version (right). An improved implementation ensures the geographic start point remains under the cursor where possible.