
UK Politician's expense visualization. U.S. Housing Market Tracker. Clustered Force Layout III. This variation of a clustered force layout uses an entry transition and careful initialization to minimize distracting jitter as the force simulation converges on a stable layout.
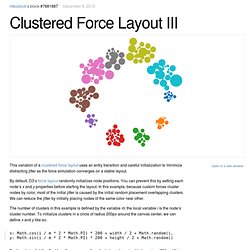
By default, D3’s force layout randomly initializes node positions. You can prevent this by setting each node’s x and y properties before starting the layout. In this example, because custom forces cluster nodes by color, most of the initial jitter is caused by the initial random placement overlapping clusters. We can reduce the jitter by initially placing nodes of the same color near other. The number of clusters in this example is defined by the variable m; the local variable i is the node’s cluster number. X: Math.cos(i / m * 2 * Math.PI) * 200 + width / 2 + Math.random(), y: Math.sin(i / m * 2 * Math.PI) * 200 + height / 2 + Math.random() Each node is slightly offset from the corresponding cluster’s center using Math.random.
This initialization strategy is arbitrary but effective. Living United States Presidents. D3.js - Data-Driven Documents. D3. Bost.ocks.org/mike/d3/workshop/ Web. [dd3] Selections in d3.js with a simple bar chart. D3.js. D3.js animated map visualization - Mark Mark Oh. Update: To create your own visualization like this, check out my project Datamaps.
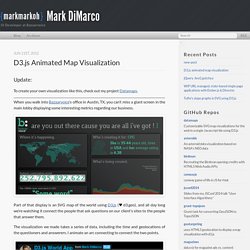
When you walk into Bazaarvoice’s office in Austin, TX, you can’t miss a giant screen in the main lobby displaying some interesting metrics regarding our business. Part of that display is an SVG map of the world using D3.js (♥ d3.geo), and all day long we’re watching it connect the people that ask questions on our client’s sites to the people that answer them. The visualization we made takes a series of data, including the time and geolocations of the questioners and answerers. I animate an arc connecting to connect the two points. Drawing a world map in D3.js: Grab the world data json data here D3.js allows us to use pure latitude/longitude coordinates the entire time.
Disclaimer: The views / words expressed in this post are my own and not representative of my employer. Introduction to d3: Build an Animated Graph in 19 Lines of Code - Need for Air. The goal of this tutorial is to give an introduction to d3.js by using the example of a simple animated bar chart. Before anything else, let’s take a look at it. Click on any bar of this chart -you can do it multiple times- to see what happens! Pretty neat, huh? You can see the gist of a standalone working HTML here. We’re going to go through the javascript part which consists of 19 lines of javascript (comments and blank lines excluded of course), on top of the d3 library. d3 (for data driven document) is a low-level javascript framework that allows you to easily bind data to elements of the DOM and manipulate them.
So why use a low-level framework to draw graphs when so many integrative chart libraries exist out there (Highcharts , Google Chart Tools …)? This example uses SVG. The first thing you should notice is that d3 uses method chaining. Selecting elements This is the core of D3: selecting elements of the DOM, and doing stuff with them. Inserting in and removing from the DOM. D3 Tutorial - CS448B Data Visualization. Bost.ocks.org/mike/d3/workshop/